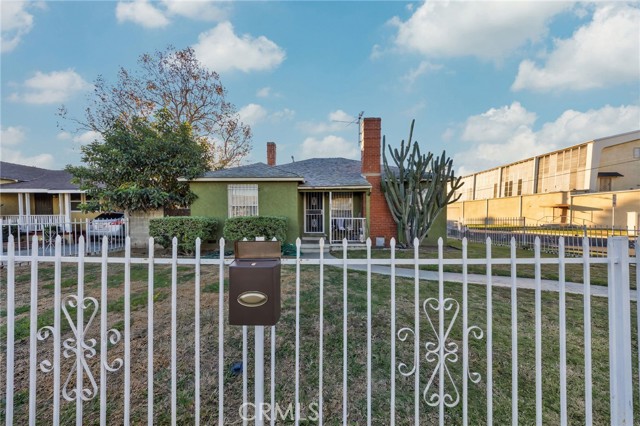
9601 South 8th, Inglewood, CA 90305
9601 South 8th, Inglewood, CA 90305
Property Description
Welcome to this desirable Inglewood property featuring a corner lot with excellent potential for an ADU! This fully gated property offers two patios, providing great spaces for outdoor relaxation and entertaining. The spacious corner-lot setting offers added flexibility and potential for additional use. Conveniently located near local parks, shopping, dining, and popular entertainment venues, including SoFi Stadium, Intuit Dome, and Kia Forum. Enjoy the convenience of being close to major event destinations while having a place to call home. A wonderful opportunity for homeowners and investors alike!
Features & Amenities
Property Details
Mortgage Calculator
Current Rates
Comparative Market Analysis
Affordable Tier · 5 active · 5 closed
Inglewood · Single Family Residence
Listed 4.0% above the median closed sale of $865,000. Price per sqft ($748) is a 32% premium to closed comps ($567). Closed comps sold at 100% of list — strong seller's market.
Price Position
Aligned with the market — fair pricing for the comps.
Active Properties (5)
Active Comparables
| Address | City | Year | BD | BTH | SqFt | LotSz | LP/SqFt | LP | DIM | Score |
|---|---|---|---|---|---|---|---|---|---|---|
| 10517 Cimarron | Los Angeles | 1947 | 3 | 2 | 1,400 | 5,455 | $621 | $869,900 | 55 | 80 |
| 1861 94th Street | Los Angeles | 1941 | 3 | 2 | 1,455 | 5,000 | $577 | $839,900 | 9 | 79 |
| 8905 Ruthelen | Los Angeles | 1938 | 3 | 2 | 1,430 | 5,402 | $559 | $800,000 | 31 | 79 |
| 9133 7th Avenue | Inglewood | 1939 | 3 | 2 | 1,430 | 8,507 | $629 | $900,000 | 28 | 78 |
| 1921 94th Street | Los Angeles | 1942 | 3 | 2 | 1,599 | 5,001 | $593 | $949,000 | 142 | 75 |
| Total: 5 · Average | 3.0 | 2.0 | 1,462.8 | 5,873 | $595.8 | $871,760 | 53 | |||
| Median | 1,430 | $869,900 | ||||||||
Closed Properties (5)
Closed Comparables
| Address | City | Year | Date | BD | BTH | SqFt | LotSz | LP | SP | SP/SqFt | SP/LP | DIM | Score |
|---|---|---|---|---|---|---|---|---|---|---|---|---|---|
| 2715 Hardy Street | Inglewood | 1948 | 10/02/2026 | 3 | 2 | 1,544 | 5,411 | $899,000 | $899,000 | $582 | 1.00 | 64 | 82 |
| 9425 10th | Inglewood | 1953 | 10/07/2026 | 3 | 2 | 1,810 | 6,908 | $888,000 | $875,000 | $483 | 0.98 | 75 | 76 |
| 9400 4th Avenue | Inglewood | 1940 | 03/20/2026 | 2 | 2 | 1,058 | 8,515 | $749,950 | $800,000 | $756 | 1.07 | 66 | 76 |
| 9619 11th Avenue | Inglewood | 1952 | 07/01/2026 | 3 | 2 | 1,606 | 7,162 | $849,999 | $865,000 | $539 | 1.02 | 50 | 75 |
| 2915 95th | Inglewood | 1947 | 04/24/2026 | 3 | 2 | 1,768 | 5,408 | $880,000 | $840,000 | $475 | 0.95 | 139 | 75 |
| Total: 5 · Average | 2.8 | 2.0 | 1,557.2 | 6,680.8 | $855,800 | $855,800 | $567 | — | 78.8 | ||||
| Median | 1,606 | $865,000 | $865,000 | ||||||||||
Market Analysis
List vs Sale $/SqFt
Sale Price Trend
Days on Market
Sale vs List Price
This analysis was generated automatically from MLS data. For an in-depth, human-reviewed valuation, contact Joseph Sardella at josephsardella@gmail.com.