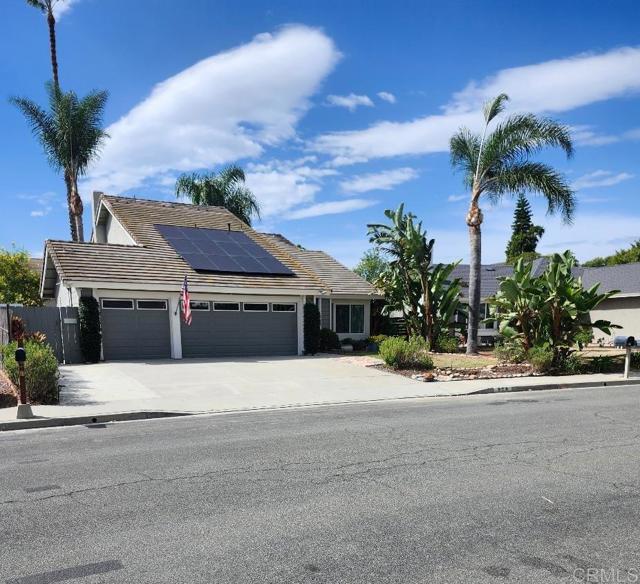
929 Goleta St., Oceanside, CA 92057
929 Goleta St., Oceanside, CA 92057
Property Description
OPEN HOUSE 1 TO 4 every Sunday Veteran Owner will transfer his VA loan at 4.125% to any buyer, vet or not. Immaculate, fully upgraded, and meticulously maintained, this turnkey residence is a rare find. Featuring four bedrooms, three full bathrooms, and a three car garage. The highly desirable floor plan includes a coveted main-floor bedroom and full bath which is perfect for guests or multi-generational living. Step into your private backyard oasis, framed by tranquil mountain views. Enjoy a thriving mini-orchard with lemon, lime, gala apple, and peach trees, with two convenient storage sheds. Every major system has been updated for ultimate peace of mind: a brand-new roof, new plumbing, paid-in-full solar, energy-efficient vinyl-clad windows, a new water heater, and a whole-house water filtration system with a 10-year warranty. Inside, the kitchen is ready for the home chef with a brand-new microwave, dishwasher, and garbage disposal. This property has been well cared for and is completely ready for you to move right in.
Features & Amenities
Property Details
Mortgage Calculator
Current Rates
Comparative Market Analysis
Residential Tier · 5 active · 5 closed
Oceanside · Single Family Residence
Listed in line with the median closed sale of $935,000. Price per sqft ($550) is a 14% premium to closed comps ($482). Closed comps sold at 100% of list — strong seller's market.
Price Position
Aligned with the market — fair pricing for the comps.
Active Properties (5)
Active Comparables
| Address | City | Year | BD | BTH | SqFt | LotSz | LP/SqFt | LP | DIM | Score |
|---|---|---|---|---|---|---|---|---|---|---|
| 4593 Mardi Gras | Oceanside | 1980 | 4 | 3 | 1,666 | 6,042 | $522 | $870,000 | 76 | 87 |
| 4499 Pebble Beach Drive | Oceanside | 1989 | 4 | 3 | 2,002 | 6,398 | $434 | $869,000 | 11 | 86 |
| 4591 Coronado Drive | Oceanside | 1990 | 4 | 3 | 2,522 | 0 | $396 | $999,767 | 23 | 79 |
| 4422 Arbor Cove Circle | Oceanside | 1996 | 3 | 2 | 1,318 | 0 | $606 | $799,000 | 31 | 75 |
| 4675 Caneel Bay Court | Oceanside | 1992 | 4 | 3 | 2,622 | 8,098 | $400 | $1.05M | 27 | 74 |
| Total: 5 · Average | 3.8 | 2.8 | 2,026 | 6,846 | $471.6 | $917,553.4 | 33.6 | |||
| Median | 2,002 | $870,000 | ||||||||
Closed Properties (5)
Closed Comparables
| Address | City | Year | Date | BD | BTH | SqFt | LotSz | LP | SP | SP/SqFt | SP/LP | DIM | Score |
|---|---|---|---|---|---|---|---|---|---|---|---|---|---|
| 792 Foxwood Drive | Oceanside | 1989 | 08/03/2026 | 3 | 3 | 1,624 | 7,242 | $849,000 | $832,000 | $512 | 0.98 | 46 | 87 |
| 4471 La Quinta | Oceanside | 1982 | 04/30/2026 | 4 | 2 | 1,741 | 7,445 | $898,888 | $898,888 | $516 | 1.00 | 34 | 85 |
| 774 Foxwood Drive | Oceanside | 1989 | 07/03/2026 | 4 | 3 | 2,002 | 6,346 | $925,000 | $935,000 | $467 | 1.01 | 16 | 84 |
| 4655 Caneel Bay Court | Oceanside | 1991 | 05/04/2026 | 4 | 3 | 2,309 | 0 | $989,000 | $989,000 | $428 | 1.00 | 70 | 79 |
| 4512 Glenview | Oceanside | 1990 | 12/10/2025 | 4 | 3 | 2,002 | 10,006 | $949,000 | $977,000 | $488 | 1.03 | 40 | 78 |
| Total: 5 · Average | 3.8 | 2.8 | 1,935.6 | 7,759.75 | $926,377.6 | $926,377.6 | $482.2 | — | 41.2 | ||||
| Median | 2,002 | $935,000 | $935,000 | ||||||||||
Market Analysis
List vs Sale $/SqFt
Sale Price Trend
Days on Market
Sale vs List Price
This analysis was generated automatically from MLS data. For an in-depth, human-reviewed valuation, contact Joseph Sardella at josephsardella@gmail.com.