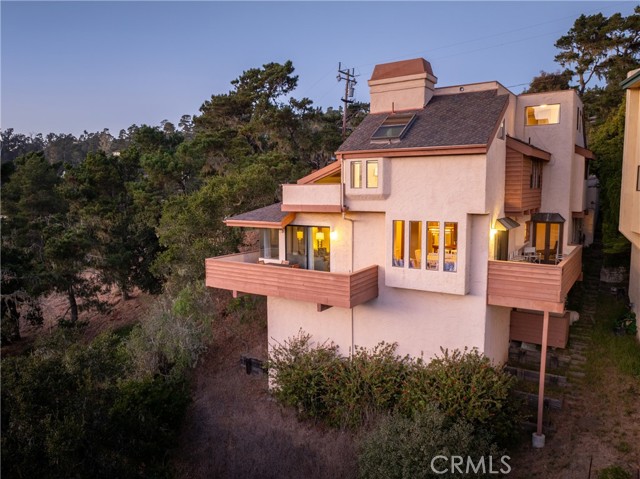
904 Hartford Street, Cambria, CA 93428
904 Hartford Street, Cambria, CA 93428
Property Description
Looking for a coastal property that can pay you back? 904 Hartford St in Cambria is a licensed short-term vacation rental, which is rare in our little village. It sells FULLY FURNISHED: 3 bedrooms, 3 baths, and 1,953 sq ft, with ocean views toward Moonstone Beach and a short walk to the village. The top level is a private studio-style suite with its own kitchenette, a three-quarter bath, and a separate entrance. It's perfect for guests, extended family, or a little extra privacy. For context, AirDNA puts Cambria's average vacation rental at about $62.7K a year in revenue, with 57% occupancy and a $357 average nightly rate over the past 12 months. That's a market average, not this home's numbers. This home's own rental history is available on request. Offered at $995,000. A new owner applies for their own county license, so let's talk timing.
Features & Amenities
Property Details
Mortgage Calculator
Current Rates
About Cambria
This property is located in Cambria, a community in Cambria. Explore more listings in this neighborhood to compare options and pricing.
View Cambria ListingsComparative Market Analysis
Residential Tier · 5 active · 5 closed
Cambria · Cambria · Single Family Residence
Listed 6.1% below the median closed sale of $1,060,000.
Price Position
Priced below the market — value advantage over the field.
Active Properties (5)
Active Comparables
| Address | City | Year | BD | BTH | SqFt | LotSz | LP/SqFt | LP | DIM | Score |
|---|---|---|---|---|---|---|---|---|---|---|
| 930 Suffolk Street | Cambria | 1986 | 3 | 3 | 1,900 | 5,007 | $497 | $945,000 | 126 | 89 |
| 470 Wellington | Cambria | 1974 | 3 | 2 | 2,021 | 3,500 | $561 | $1.13M | 121 | 84 |
| 1927 Norwich | Cambria | 1981 | 3 | 2 | 1,292 | 3,500 | $724 | $935,000 | 71 | 75 |
| 2925 Buckingham Place | Cambria | 1985 | 3 | 2 | 1,626 | 7,500 | $522 | $849,000 | 12 | 74 |
| 2410 Langton | Cambria | 1938 | 4 | 3 | 1,916 | 7,000 | $469 | $899,000 | 66 | 73 |
| Total: 5 · Average | 3.2 | 2.4 | 1,751 | 5,301.4 | $554.6 | $952,400 | 79.2 | |||
| Median | 1,900 | $935,000 | ||||||||
Closed Properties (5)
Closed Comparables
| Address | City | Year | Date | BD | BTH | SqFt | LotSz | LP | SP | SP/SqFt | SP/LP | DIM | Score |
|---|---|---|---|---|---|---|---|---|---|---|---|---|---|
| 676 Canterbury | Cambria | 1979 | 06/17/2026 | 3 | 3 | 1,750 | 4,250 | $995,000 | $1.05M | $600 | 1.05 | 33 | 88 |
| 675 Huntington | Cambria | 1983 | 06/22/2026 | 3 | 3 | 2,156 | 3,500 | $1.20M | $1.10M | $510 | 0.92 | 34 | 87 |
| 5950 Sunbury Avenue | Cambria | 1982 | 08/27/2026 | 3 | 2 | 2,054 | 3,500 | $998,000 | $1.00M | $487 | 1.00 | 36 | 87 |
| 5521 Sunbury | Cambria | 2002 | 06/10/2026 | 4 | 3 | 2,317 | 5,350 | $1.07M | $1.06M | $457 | 0.99 | 154 | 87 |
| 492 Dorset Street | Cambria | 1984 | 10/05/2026 | 2 | 2 | 1,438 | 3,500 | $1.24M | $1.10M | $763 | 0.89 | 103 | 82 |
| Total: 5 · Average | 3.0 | 2.6 | 1,943 | 4,020 | $1.06M | $1.06M | $563.4 | — | 72 | ||||
| Median | 2,054 | $1.06M | $1.06M | ||||||||||
Market Analysis
List vs Sale $/SqFt
Sale Price Trend
Days on Market
Sale vs List Price
This analysis was generated automatically from MLS data. For an in-depth, human-reviewed valuation, contact Joseph Sardella at josephsardella@gmail.com.