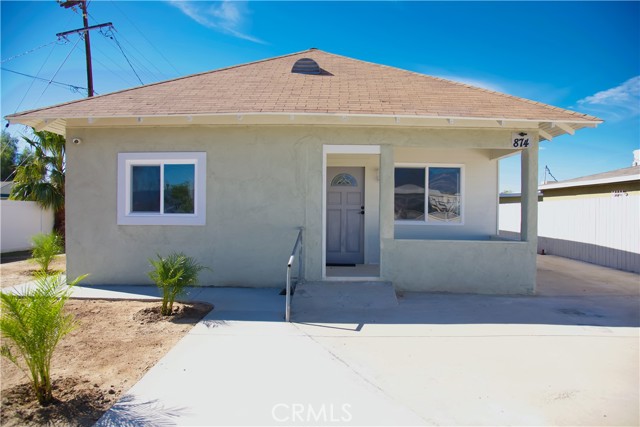
874 South State, San Jacinto, CA 92583
874 South State, San Jacinto, CA 92583
Property Description
Come check out this versatile property featuring 3 bedrooms and 2 bathrooms in residential/commercial zoning. This cozy home features a separate side entrance, and plenty of parking. Ideally suited for someone looking to combine living and business in one convenient location. Enjoy a great location along with shopping, services, and other local businesses nearby. Whether you’re looking for a place to call home, operate a small business, or enjoy the flexibility of both, this property offers plenty of possibilities!
Features & Amenities
Property Details
Mortgage Calculator
Current Rates
Comparative Market Analysis
Affordable Tier · 5 active · 5 closed
San Jacinto · Single Family Residence
Listed 13.3% above the median closed sale of $450,000. Price per sqft ($442) is a 37% premium to closed comps ($323). Closed comps sold at 103% of list — strong seller's market.
Price Position
Positioned above the market — commands a premium.
Active Properties (5)
Active Comparables
| Address | City | Year | BD | BTH | SqFt | LotSz | LP/SqFt | LP | DIM | Score |
|---|---|---|---|---|---|---|---|---|---|---|
| 250 Wateka | San Jacinto | 1928 | 3 | 2 | 1,532 | 13,939 | $290 | $445,000 | 8 | 76 |
| 378 Oleander Drive | San Jacinto | 1985 | 3 | 3 | 1,546 | 7,841 | $288 | $445,000 | 10 | 73 |
| 260 Mahogany | San Jacinto | 2001 | 4 | 3 | 1,985 | 3,485 | $227 | $449,900 | 266 | 53 |
| 1271 Pardee Street | San Jacinto | 2005 | 4 | 3 | 2,472 | 5,227 | $202 | $499,000 | 85 | 51 |
| 1198 Oasis Court | San Jacinto | 2006 | 5 | 3 | 2,515 | 9,583 | $223 | $560,000 | 65 | 50 |
| Total: 5 · Average | 3.8 | 2.8 | 2,010 | 8,015 | $246 | $479,780 | 86.8 | |||
| Median | 1,985 | $449,900 | ||||||||
Closed Properties (5)
Closed Comparables
| Address | City | Year | Date | BD | BTH | SqFt | LotSz | LP | SP | SP/SqFt | SP/LP | DIM | Score |
|---|---|---|---|---|---|---|---|---|---|---|---|---|---|
| 409 Camellia Way | San Jacinto | 1956 | 04/27/2026 | 4 | 2 | 1,196 | 6,970 | $429,900 | $445,000 | $372 | 1.03 | 46 | 76 |
| 1223 Pardee | San Jacinto | 2018 | 08/07/2026 | 3 | 2 | 1,558 | 5,227 | $459,999 | $467,499 | $300 | 1.02 | 35 | 73 |
| 476 Camellia Way | San Jacinto | 2022 | 10/20/2026 | 3 | 2 | 1,542 | 15,246 | $499,999 | $510,000 | $331 | 1.02 | 40 | 72 |
| 294 Quiet Court | San Jacinto | 2006 | 08/26/2026 | 3 | 2 | 1,556 | 7,405 | $425,000 | $442,000 | $284 | 1.04 | 43 | 72 |
| 301 Oleander | San Jacinto | 1985 | 05/26/2026 | 4 | 3 | 1,375 | 6,970 | $439,000 | $450,000 | $327 | 1.02 | 74 | 70 |
| Total: 5 · Average | 3.4 | 2.2 | 1,445.4 | 8,363.6 | $462,899.8 | $462,899.8 | $322.8 | — | 47.6 | ||||
| Median | 1,542 | $450,000 | $450,000 | ||||||||||
Market Analysis
List vs Sale $/SqFt
Sale Price Trend
Days on Market
Sale vs List Price
This analysis was generated automatically from MLS data. For an in-depth, human-reviewed valuation, contact Joseph Sardella at josephsardella@gmail.com.