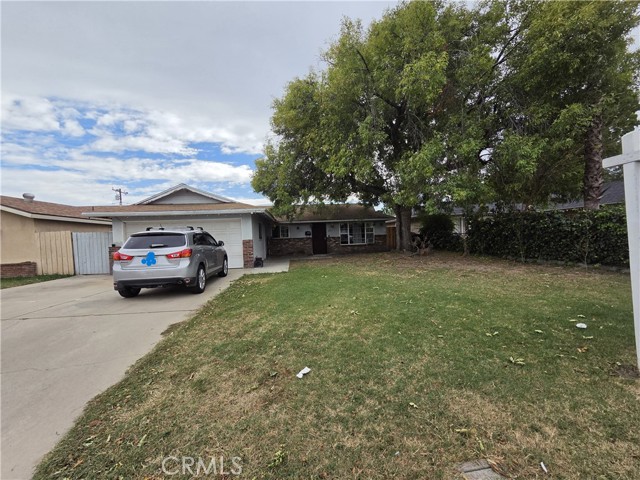
842 East Yale Street, Ontario, CA 91764
842 East Yale Street, Ontario, CA 91764
Property Description
Welcome to 842 E Yale St. a quiet cul-de-sac in an established Ontario neighborhood. These 3 bedrooms, 1 1/3 Bath home with additional den its be used as an extra room, this home sits on a large 7,425 Sq Ft lot size. 1,530 Sq Ft of living space, spacious backyard and front yard, 2 car garage attached, and extra parking on driveway, large kitchen, conveniently located near freeway, shopping, dining, schools, parks, great location, call today to schedule your showing.
Features & Amenities
Property Details
Mortgage Calculator
Current Rates
Comparative Market Analysis
Residential Tier · 5 active · 5 closed
Ontario · Single Family Residence
Listed 6.7% below the median closed sale of $670,000. Closed comps sold at 101% of list — strong seller's market.
Price Position
Priced below the market — value advantage over the field.
Active Properties (5)
Active Comparables
| Address | City | Year | BD | BTH | SqFt | LotSz | LP/SqFt | LP | DIM | Score |
|---|---|---|---|---|---|---|---|---|---|---|
| 616 E Sixth St | Ontario | 1951 | 3 | 2 | 1,318 | 7,710 | $493 | $650,000 | 2 | 91 |
| 921 5th Street | Ontario | 1953 | 3 | 2 | 1,041 | 7,140 | $615 | $639,999 | 41 | 89 |
| 824 I Street | Ontario | 1960 | 3 | 1 | 1,122 | 7,176 | $552 | $619,000 | 38 | 87 |
| 641 Plaza Serena | Ontario | 1926 | 3 | 2 | 1,318 | 5,684 | $531 | $699,995 | 18 | 84 |
| 1038 J Street | Ontario | 1947 | 3 | 1 | 973 | 7,320 | $665 | $647,500 | 115 | 77 |
| Total: 5 · Average | 3.0 | 1.6 | 1,154.4 | 7,006 | $571.2 | $651,298.8 | 42.8 | |||
| Median | 1,122 | $647,500 | ||||||||
Closed Properties (5)
Closed Comparables
| Address | City | Year | Date | BD | BTH | SqFt | LotSz | LP | SP | SP/SqFt | SP/LP | DIM | Score |
|---|---|---|---|---|---|---|---|---|---|---|---|---|---|
| 819 Plaza Serena | Ontario | 1952 | 10/21/2026 | 3 | 2 | 1,492 | 7,105 | $680,000 | $687,000 | $460 | 1.01 | 64 | 94 |
| 741 Granada Court | Ontario | 1952 | 07/21/2026 | 3 | 2 | 1,550 | 7,370 | $675,000 | $670,000 | $432 | 0.99 | 62 | 92 |
| 1106 Sultana Avenue | Ontario | 1955 | 07/30/2026 | 3 | 2 | 1,558 | 8,216 | $715,000 | $710,000 | $456 | 0.99 | 28 | 92 |
| 945 5th Street | Ontario | 1954 | 10/14/2026 | 4 | 2 | 1,386 | 6,695 | $599,900 | $610,000 | $440 | 1.02 | 49 | 90 |
| 709 J Street | Ontario | 1957 | 08/06/2026 | 4 | 2 | 1,402 | 6,916 | $625,000 | $665,000 | $474 | 1.06 | 59 | 89 |
| Total: 5 · Average | 3.4 | 2.0 | 1,477.6 | 7,260.4 | $668,400 | $668,400 | $452.4 | — | 52.4 | ||||
| Median | 1,492 | $670,000 | $670,000 | ||||||||||
Market Analysis
List vs Sale $/SqFt
Sale Price Trend
Days on Market
Sale vs List Price
This analysis was generated automatically from MLS data. For an in-depth, human-reviewed valuation, contact Joseph Sardella at josephsardella@gmail.com.