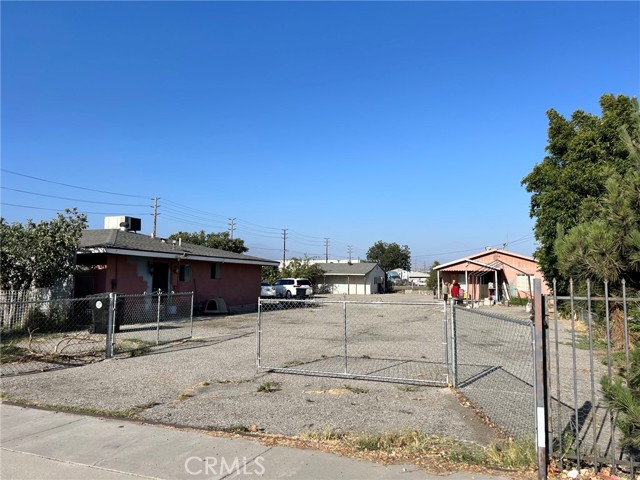
1 / 1
833 South Waterman Avenue, San Bernardino, CA 92408
$500K3bd · 2ba · 1,368 sqft
Lot 12,000 sqft•Single Family Residence•Active•4d on market•MLS# TR-26242644
833 South Waterman Avenue, San Bernardino, CA 92408
MLS# TR-26242644•Residential•Single Family Residence
Active4 days on market
$500,000
3
Beds
2
Baths
1,368
Sq Ft
12,000
Lot Sq Ft
1965
Year Built
None
View
Property Description
BEING SOLD AS-IS, A FIXER UPPER with great potential, featuring 3 bedrooms and 2 baths. An avocado and a pomegranate trees are on property. Buyer and buyer's agent to conduct due diligence to verify property information and permits. NOTE: 833 S. Waterman Ave. must be purchased together with 837 S. Waterman Ave. and escrows to close at the same time.
Features & Amenities
FeeBuilt 1965
Property Details
Land Type
Fee
Year Built
1965
Property Type
Residential
Property Subtype
Single Family Residence
Parking Spaces
1
Garage Spaces
1
Heating
Space Heater
Cooling
None
View
None
Flooring
Carpet
City
San Bernardino
Zip Code
92408
County
San Bernardino
Mortgage Calculator
Current Rates
$
$
%
Monthly Payment
$2,528.27
Principal & Interest
Loan Amount
$400,000
Total Interest
$510,178
Total Payment Over 30 Years
$910,178
This calculator provides estimates only. Actual mortgage payments may include taxes, insurance, HOA fees, and PMI. Contact a lender for accurate quotes.
Comparative Market Analysis
Affordable Tier · 5 active · 5 closed
833 South Waterman Avenue, San Bernardino, CA 92408
San Bernardino · Single Family Residence
$500K
Affordable TierBeds
3
Baths
2
Sqft
1,368
Lot
12,000 sqft
Year
1965
$/Sqft
$365
Pool: No✓
View: None✓
Garage: 1-car✓
Listed in line with the median closed sale of $495,000. Closed comps sold at 101% of list — strong seller's market.
Price Position
Aligned with the market — fair pricing for the comps.
At market
Subject listed at $500K· $365/sqft
Total list price
Closed comps
vs closed median $495K
+$5K (+1.0%)
Active comps
vs active median $450K
+$50K (+11.1%)
Price per sqft
Closed compsinsufficient comp data
Active comps
vs active avg $/sqft $370
−$5 (−1.5%)
Active Properties (5)
Active Comparables
| Address | City | Year | BD | BTH | SqFt | LotSz | LP/SqFt | LP | DIM | Score |
|---|---|---|---|---|---|---|---|---|---|---|
| 24775 Ward | San Bernardino | 1962 | 3 | 2 | 1,152 | 7,020 | $430 | $495,000 | 106 | 76 |
| 24809 Benedict | San Bernardino | 1895 | 4 | 2 | 1,198 | 6,250 | $376 | $450,000 | 111 | 74 |
| 1482 Davidson | San Bernardino | 1968 | 4 | 2 | 1,747 | 9,275 | $243 | $425,000 | 49 | 73 |
| 965 Kansas | Colton | 1943 | 3 | 2 | 1,214 | 6,916 | $391 | $475,000 | 40 | 73 |
| 840 Valley View Drive | San Bernardino | 1928 | 2 | 2 | 1,093 | 7,155 | $412 | $449,777 | 51 | 71 |
| Total: 5 · Average | 3.2 | 2.0 | 1,280.8 | 7,323.2 | $370.4 | $458,955.4 | 71.4 | |||
| Median | 1,198 | $450,000 | ||||||||
Closed Properties (5)
Closed Comparables
| Address | City | Year | Date | BD | BTH | SqFt | LotSz | LP | SP | SP/SqFt | SP/LP | DIM | Score |
|---|---|---|---|---|---|---|---|---|---|---|---|---|---|
| 1575 Tippecanoe | San Bernardino | 1958 | 10/30/2026 | 3 | 2 | 1,513 | 12,420 | $450,000 | $437,000 | $289 | 0.97 | 66 | 83 |
| 164 Valley Street | San Bernardino | 2005 | 11/02/2026 | 3 | 2 | 1,224 | 7,500 | $479,000 | $495,000 | $404 | 1.03 | 64 | 80 |
| 801 Maryess Drive | San Bernardino | 1945 | 10/13/2026 | 3 | 1 | 1,316 | 6,380 | $495,000 | $495,000 | $376 | 1.00 | 89 | 75 |
| 24790 Monterey | San Bernardino | 1953 | 04/17/2026 | 3 | 2 | 1,512 | 7,020 | $515,000 | $530,000 | $351 | 1.03 | 189 | 75 |
| 1064 Congress Street | San Bernardino | 1944 | 06/30/2026 | 3 | 2 | 1,278 | 7,300 | $455,000 | $470,000 | $368 | 1.03 | 82 | 74 |
| Total: 5 · Average | 3.0 | 1.8 | 1,368.6 | 8,124 | $485,400 | $485,400 | $357.6 | — | 98 | ||||
| Median | 1,316 | $495,000 | $495,000 | ||||||||||
Market Analysis
List vs Sale $/SqFt
Sale Price Trend
Days on Market
Sale vs List Price
AI-generated CMA
This analysis was generated automatically from MLS data. For an in-depth, human-reviewed valuation, contact Joseph Sardella at josephsardella@gmail.com.