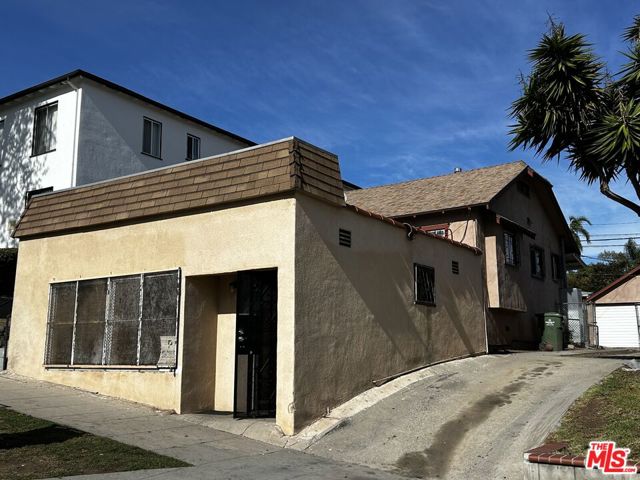
815 East Hyde Park Boulevard, Inglewood, CA 90302
815 East Hyde Park Boulevard, Inglewood, CA 90302
Property Description
THE MAIN HOUSE IS 2 BEDROOM 1 BATHROOM TOTALING 756 SQUARE FEET AND A BONUS BUILDING THAT IS APPROX. 400+/- SQUARE FEET WITH A BATHROOM SHOWER KITCHEN AND LIVING AREA THAT OWNER MAKES TO REPRESENTATIONS REGARDING. BUYER TO DO THEIR OWN DUE DILIGENCE TO USE AND PERMITTING OF BONUS STRUCTURE. THERE WAS A RESIDENTAL LEASE ON THE BONUS SPACE PRIOR TO 2020 WHICH POTENTIALLY MAKES IT ELIGIBLE FOR AB2533 CONVERSION TO ACCESORY DWELLING UNIT.
Features & Amenities
Property Details
Mortgage Calculator
Current Rates
Comparative Market Analysis
Affordable Tier · 5 active · 5 closed
Inglewood · Single Family Residence
Listed 6.2% below the median closed sale of $800,000. Price per sqft ($992) is a 42% premium to closed comps ($698). Closed comps sold at 102% of list — strong seller's market.
Price Position
Priced below the market — value advantage over the field.
Active Properties (5)
Active Comparables
| Address | City | Year | BD | BTH | SqFt | LotSz | LP/SqFt | LP | DIM | Score |
|---|---|---|---|---|---|---|---|---|---|---|
| 909 Brett Street | Inglewood | 1923 | 2 | 1 | 864 | 5,607 | $763 | $659,000 | 58 | 93 |
| 4316 59th Street | Los Angeles | 1948 | 2 | 1 | 840 | 5,429 | $774 | $650,000 | 52 | 80 |
| 3123 67th | Los Angeles | 1922 | 2 | 2 | 990 | 4,440 | $706 | $699,000 | 2 | 77 |
| 1315 Field Avenue | Inglewood | 1947 | 2 | 2 | 984 | 2,553 | $700 | $689,000 | 16 | 74 |
| 3831 59th Place | Los Angeles | 1923 | 3 | 1 | 1,270 | 5,456 | $661 | $839,950 | 2 | 73 |
| Total: 5 · Average | 2.2 | 1.4 | 989.6 | 4,697 | $720.8 | $707,390 | 26 | |||
| Median | 984 | $689,000 | ||||||||
Closed Properties (5)
Closed Comparables
| Address | City | Year | Date | BD | BTH | SqFt | LotSz | LP | SP | SP/SqFt | SP/LP | DIM | Score |
|---|---|---|---|---|---|---|---|---|---|---|---|---|---|
| 1144 65th | Inglewood | 1922 | 09/02/2026 | 3 | 1 | 950 | 5,005 | $749,000 | $800,000 | $842 | 1.07 | 294 | 85 |
| 1109 Chester Avenue | Inglewood | 1925 | 11/12/2026 | 3 | 2 | 1,000 | 3,625 | $699,900 | $683,000 | $683 | 0.98 | 155 | 82 |
| 1218 Park Avenue | Inglewood | 1923 | 09/30/2026 | 2 | 2 | 1,244 | 6,375 | $799,000 | $850,000 | $683 | 1.06 | 14 | 77 |
| 3826 64th | Inglewood | 1923 | 01/20/2026 | 3 | 2 | 1,170 | 5,384 | $835,000 | $830,000 | $709 | 0.99 | 55 | 71 |
| 6030 Alviso Avenue | Los Angeles | 1926 | 04/28/2026 | 3 | 1 | 1,297 | 4,828 | $735,000 | $740,000 | $571 | 1.01 | 70 | 70 |
| Total: 5 · Average | 2.8 | 1.6 | 1,132.2 | 5,043.4 | $780,600 | $780,600 | $697.6 | — | 117.6 | ||||
| Median | 1,170 | $800,000 | $800,000 | ||||||||||
Market Analysis
List vs Sale $/SqFt
Sale Price Trend
Days on Market
Sale vs List Price
This analysis was generated automatically from MLS data. For an in-depth, human-reviewed valuation, contact Joseph Sardella at josephsardella@gmail.com.