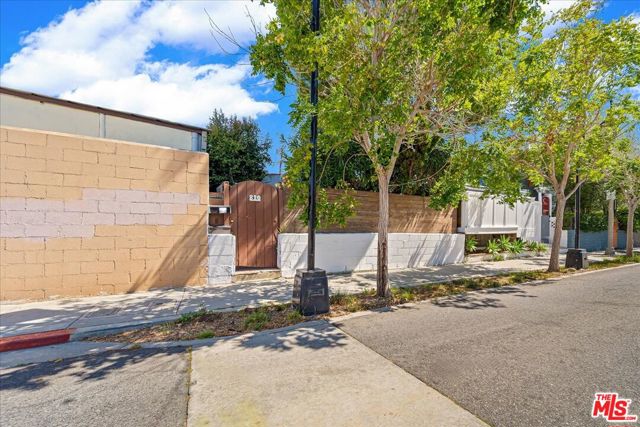
810 Navy Street, Santa Monica, CA 90405
810 Navy Street, Santa Monica, CA 90405
Property Description
Motivated seller, Prime beach cottage fixer located in the Ocean Park area of Santa Monica, This property affords a wide range of opportunity with a zoning that allows mixed use for housing or commercial use. This is a rare property that is strategic for development in a highly sought after location, ideal for owner-user, investor, or adaptable development concept. Property will be delivered vacant. Inspection report and information on zoning options for development available upon request. Seller will accept bids in excess of $895,000 and all offers need to be received by December 31st, 2026.
Features & Amenities
Property Details
Mortgage Calculator
Current Rates
Comparative Market Analysis
Affordable Tier · 5 active · 5 closed
Santa Monica · Single Family Residence
Listed in line with the median closed sale of $912,500. Price per sqft ($1,373) is a 54% premium to closed comps ($893). Expect a longer timeline — comps averaged 134 days on market.
Price Position
Aligned with the market — fair pricing for the comps.
Active Properties (5)
Active Comparables
| Address | City | Year | BD | BTH | SqFt | LotSz | LP/SqFt | LP | DIM | Score |
|---|---|---|---|---|---|---|---|---|---|---|
| 806 Navy Street | Santa Monica | 1951 | 2 | 1 | 860 | 1,987 | $1,157 | $995,000 | 23 | 78 |
| 11416 Venice Boulevard | Los Angeles | 1951 | 2 | 1 | 776 | 2,499 | $1,030 | $799,000 | 109 | 55 |
| 2220 Bundy Drive | Los Angeles | 1951 | 2 | 2 | 927 | 3,274 | $862 | $799,000 | 27 | 52 |
| 11790 Radio Drive | Los Angeles | 1946 | 2 | 1 | 1,322 | 4,726 | $635 | $839,000 | 19 | 40 |
| 919 2nd | Santa Ana | 2022 | 4 | 4 | 2,284 | 2,334 | $438 | $999,900 | 191 | 20 |
| Total: 5 · Average | 2.4 | 1.8 | 1,233.8 | 2,964 | $824.4 | $886,380 | 73.8 | |||
| Median | 927 | $839,000 | ||||||||
Closed Properties (5)
Closed Comparables
| Address | City | Year | Date | BD | BTH | SqFt | LotSz | LP | SP | SP/SqFt | SP/LP | DIM | Score |
|---|---|---|---|---|---|---|---|---|---|---|---|---|---|
| 2416 Walnut Avenue | Los Angeles | 1923 | 09/17/2026 | 2 | 1 | 600 | 1,800 | $899,000 | $995,000 | $1,658 | 1.11 | 23 | 79 |
| 1137 Cabrillo Avenue | Venice | 1921 | 02/06/2026 | 2 | 1 | 934 | 2,550 | $912,500 | $912,500 | $977 | 1.00 | 259 | 70 |
| 350 Java | Morro Bay | 2012 | 07/02/2026 | 2 | 2 | 970 | 2,400 | $799,000 | $792,350 | $817 | 0.99 | 49 | 59 |
| 814 5th Avenue | Los Angeles | 1923 | 11/06/2026 | 4 | 2 | 2,250 | 7,190 | $1.20M | $1.00M | $444 | 0.83 | 80 | 52 |
| 1139 Cabrillo Avenue | Venice | 1971 | 02/06/2026 | 0 | 1 | 1,600 | 2,550 | $912,500 | $912,500 | $570 | 1.00 | 259 | 49 |
| Total: 5 · Average | 2.0 | 1.4 | 1,270.8 | 3,298 | $922,470 | $922,470 | $893.2 | — | 134 | ||||
| Median | 970 | $912,500 | $912,500 | ||||||||||
Market Analysis
List vs Sale $/SqFt
Sale Price Trend
Days on Market
Sale vs List Price
This analysis was generated automatically from MLS data. For an in-depth, human-reviewed valuation, contact Joseph Sardella at josephsardella@gmail.com.