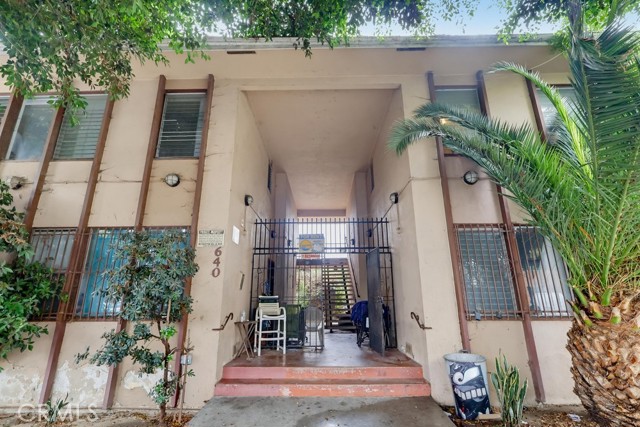
640 Elm Ave., 11, Long Beach, CA 90802
640 Elm Ave., 11, Long Beach, CA 90802
Property Description
Second floor 1 bedroom with bonus room. Mid Century OYO in the East Village Arts District. Fan lamps in bedroom and bonus room. Kitchen has electric cooktop and oven, with granite countertops. New carpet is being installed in the bedroom. HOA is only $97.20 monthly, and includes water and trash. This is a probate sale with full authority (no court confirmation. Walk to Metro rail and bus stop is at 6th and Elm. Three blocks from Pine Street and all of its restaurants and entertainment.
Features & Amenities
Property Details
Mortgage Calculator
Current Rates
Comparative Market Analysis
Affordable Tier · 5 active · 4 closed
Long Beach · Own Your Own
Listed 5.9% above the median closed sale of $212,500. Price per sqft ($340) is a 23% discount to closed comps ($441). Closed comps sold at 94% of list — buyers have negotiating leverage.
Price Position
Aligned with the market — fair pricing for the comps.
Active Properties (5)
Active Comparables
| Address | City | Year | BD | BTH | SqFt | LotSz | LP/SqFt | LP | DIM | Score |
|---|---|---|---|---|---|---|---|---|---|---|
| 640 Elm Ave. | Long Beach | 1959 | 1 | 1 | 639 | 15,047 | $352 | $225,000 | 112 | 97 |
| 640 Elm Avenue | Long Beach | 1959 | 1 | 1 | 642 | 0 | $350 | $225,000 | 112 | 97 |
| 640 Elm Avenue | Long Beach | 1959 | 1 | 1 | 703 | 15,047 | $320 | $225,000 | 112 | 97 |
| 640 Elm Avenue | Long Beach | 1959 | 1 | 1 | 699 | 0 | $322 | $225,000 | 112 | 97 |
| 640 Elm Ave. | Long Beach | 1959 | 1 | 1 | 637 | 0 | $353 | $225,000 | 112 | 96 |
| Total: 5 · Average | 1.0 | 1.0 | 664 | 15,047 | $339.4 | $225,000 | 112 | |||
| Median | 642 | $225,000 | ||||||||
Closed Properties (4)
Closed Comparables
| Address | City | Year | Date | BD | BTH | SqFt | LotSz | LP | SP | SP/SqFt | SP/LP | DIM | Score |
|---|---|---|---|---|---|---|---|---|---|---|---|---|---|
| 640 Elm Avenue | Long Beach | 1959 | 10/07/2026 | 1 | 1 | 638 | 0 | $225,000 | $210,000 | $329 | 0.93 | 73 | 97 |
| 640 Elm Avenue | Long Beach | 1959 | 05/19/2026 | 1 | 1 | 665 | 15,047 | $260,000 | $249,000 | $374 | 0.96 | 132 | 96 |
| 723 3rd | Long Beach | 1928 | 12/16/2025 | 0 | 1 | 490 | 0 | $229,000 | $210,000 | $429 | 0.92 | 85 | 71 |
| 354 Chestnut Avenue | Long Beach | 1913 | 04/07/2026 | 0 | 1 | 340 | 12,986 | $225,000 | $215,000 | $632 | 0.96 | 67 | 68 |
| Total: 4 · Average | 0.5 | 1.0 | 533.25 | 14,016.5 | $221,000 | $221,000 | $441 | — | 89.25 | ||||
| Median | 638 | $215,000 | $215,000 | ||||||||||
Market Analysis
List vs Sale $/SqFt
Sale Price Trend
Days on Market
Sale vs List Price
This analysis was generated automatically from MLS data. For an in-depth, human-reviewed valuation, contact Joseph Sardella at josephsardella@gmail.com.