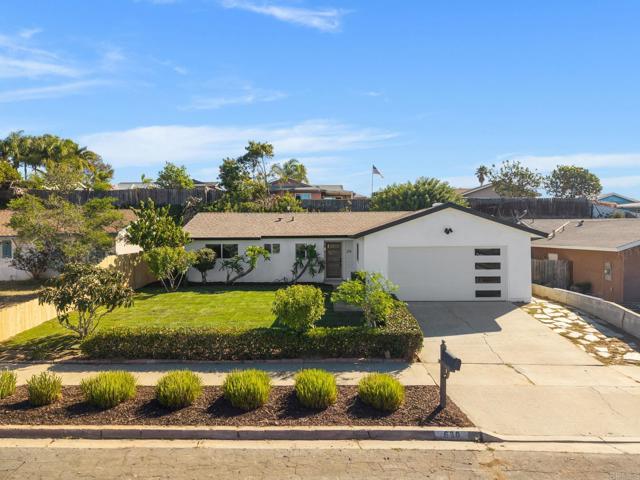
630 Ann Street, Oceanside, CA 92057
630 Ann Street, Oceanside, CA 92057
Property Description
Beautifully renovated single-story home in Oceanside! This 3-bedroom, 2-bathroom property has been updated throughout with modern finishes and a fresh, contemporary feel. Featuring a functional layout, inviting living spaces, great curb appeal, a spacious front yard, and an attached garage. Located in an established Oceanside neighborhood with convenient access to shopping, dining, and North County amenities. Move-in ready and thoughtfully updated, this home is one you won't want to miss!
Features & Amenities
Property Details
Mortgage Calculator
Current Rates
Comparative Market Analysis
Affordable Tier · 5 active · 5 closed
Oceanside · Single Family Residence
Listed 4.6% above the median closed sale of $765,000. Price per sqft ($745) is a 19% premium to closed comps ($625). Closed comps sold at 100% of list — strong seller's market.
Price Position
Aligned with the market — fair pricing for the comps.
Active Properties (5)
Active Comparables
| Address | City | Year | BD | BTH | SqFt | LotSz | LP/SqFt | LP | DIM | Score |
|---|---|---|---|---|---|---|---|---|---|---|
| 652 Parker | Oceanside | 1968 | 4 | 2 | 1,192 | 6,900 | $654 | $779,000 | 38 | 92 |
| 722 Isidore Street | Oceanside | 1986 | 3 | 2 | 1,210 | 9,622 | $701 | $848,000 | 31 | 86 |
| 305 Trunks | Oceanside | 1989 | 3 | 2 | 1,352 | 8,129 | $555 | $750,000 | 3 | 81 |
| 4925 Siesta Drive | Oceanside | 1964 | 3 | 2 | 1,496 | 6,098 | $495 | $739,900 | 59 | 79 |
| 652 Irene Road | Oceanside | 1986 | 4 | 2 | 1,441 | 9,583 | $590 | $849,999 | 6 | 78 |
| Total: 5 · Average | 3.4 | 2.0 | 1,338.2 | 8,066.4 | $599 | $793,379.8 | 27.4 | |||
| Median | 1,352 | $779,000 | ||||||||
Closed Properties (5)
Closed Comparables
| Address | City | Year | Date | BD | BTH | SqFt | LotSz | LP | SP | SP/SqFt | SP/LP | DIM | Score |
|---|---|---|---|---|---|---|---|---|---|---|---|---|---|
| 4907 Stephanie Pl | Oceanside | 1970 | 05/18/2026 | 3 | 2 | 1,074 | 8,400 | $798,000 | $820,000 | $764 | 1.03 | 37 | 94 |
| 656 Parker Street | Oceanside | 1968 | 07/31/2026 | 4 | 2 | 1,239 | 7,000 | $749,000 | $765,000 | $617 | 1.02 | 56 | 90 |
| 4969 Stephanie Pl | Oceanside | 1969 | 07/01/2026 | 4 | 2 | 1,239 | 10,000 | $760,000 | $760,000 | $613 | 1.00 | 76 | 87 |
| 4795 Stephanie | Oceanside | 1973 | 01/30/2026 | 4 | 2 | 1,180 | 6,000 | $769,375 | $770,000 | $653 | 1.00 | 60 | 85 |
| 635 Michael Street | Oceanside | 1969 | 08/10/2026 | 4 | 2 | 1,500 | 6,600 | $734,000 | $717,000 | $478 | 0.98 | 45 | 85 |
| Total: 5 · Average | 3.8 | 2.0 | 1,246.4 | 7,600 | $766,400 | $766,400 | $625 | — | 54.8 | ||||
| Median | 1,239 | $765,000 | $765,000 | ||||||||||
Market Analysis
List vs Sale $/SqFt
Sale Price Trend
Days on Market
Sale vs List Price
This analysis was generated automatically from MLS data. For an in-depth, human-reviewed valuation, contact Joseph Sardella at josephsardella@gmail.com.