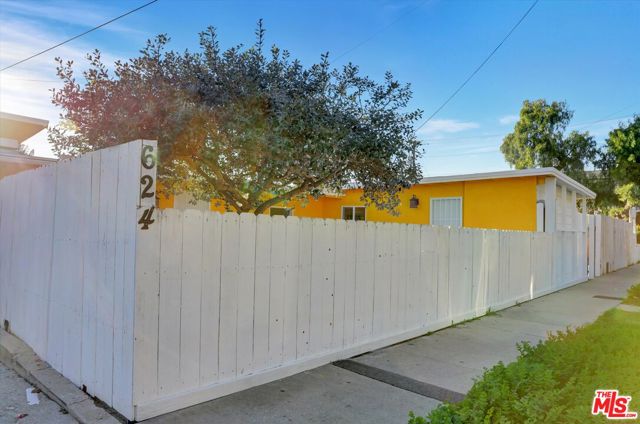
624 West Beach Avenue, Inglewood, CA 90302
624 West Beach Avenue, Inglewood, CA 90302
Property Description
****BACK TO MARKET & BRING YOUR OFFER. *********** **************************************"This home is located in a census tract that qualifies for a $20,000 grant and special financing through City National Bank. For qualifications and restrictions, please contact CNB loan directly and details are in the agent remarks.******************************************************************************* Rare 3-Unit Opportunity in North Inglewood. The owner can live 1 unit and get the rental income from the other units. Fully Remodeled & Move-In Ready! Discover the perfect blend of versatility and income potential in this meticulously renovated multi-unit property. Quiet neighborhood with a Rec. Center and elementary school up the block and nearby Rogers park. Located minutes from SoFi Stadium, the Intuit Dome, and Westfield Culver City, this North Inglewood gem is ready for move-in, rental, or both. The property features approximately 1470 SF of functional living space (Title shows 1,182 SF) thoughtfully divided into three distinct units, each with its own kitchen and private entrance: Main House (Front): A spacious 2-Bedroom, 1-Bathroom unit (~660 SF). Side House (Side): A private 1-Bedroom, 1-Bathroom unit (~550 SF). Detached ADU: A bright, permitted Studio with 1 Bathroom (~250 SF) situated above the garage which is available for income on Day 1 and Top-to-Bottom Renovation: Enjoy total peace of mind with brand-new kitchen appliances, modern flooring, HVAC (Main House), updated heaters, stylish bathrooms, newly-installed lighting, and fresh interior/exterior paint throughout. Exterior & Parking: The 4,390 SF lot offers a welcoming front yard and a large, grassy backyards blank canvas for outdoor entertaining. Parking is a breeze with a 1-car garage and a long driveway for tandem parking(3). Prime Location: Unbeatable proximity to the 405, LAX, and the burgeoning tech hubs of Culver City and Silicon Beach nearby Marina Del Rey. With a projected gross monthly rent of up to $7,300($3000/$2300/$2000). The projected GRI is 11.4 and 7.4CAP. This turn-key property offers a rare chance to offset your mortgage or maximize your portfolio in one of LA's most exciting neighborhoods. Buyer to do their own due diligence and is advised to independently verify the accuracy of all information including square footage, age, permits, condition, etc. The property is to be sold As Is. Get it before it's gone!.
Features & Amenities
Property Details
Mortgage Calculator
Current Rates
Comparative Market Analysis
Affordable Tier · 5 active · 5 closed
Inglewood · Single Family Residence
Listed in line with the median closed sale of $918,185.
Price Position
Aligned with the market — fair pricing for the comps.
Active Properties (5)
Active Comparables
| Address | City | Year | BD | BTH | SqFt | LotSz | LP/SqFt | LP | DIM | Score |
|---|---|---|---|---|---|---|---|---|---|---|
| 529 Olive Street | Inglewood | 1926 | 3 | 2 | 1,220 | 4,232 | $652 | $795,000 | 13 | 84 |
| 439 Hillsdale | Inglewood | 1940 | 2 | 1 | 1,039 | 5,426 | $885 | $920,000 | 36 | 77 |
| 328 Plymouth Street | Inglewood | 1953 | 3 | 2 | 1,436 | 7,518 | $623 | $895,000 | 187 | 77 |
| 332 Plymouth Street | Inglewood | 1951 | 3 | 2 | 1,650 | 6,752 | $576 | $950,000 | 100 | 75 |
| 550 Hillsdale Street | Inglewood | 2017 | 3 | 2 | 1,333 | 6,008 | $739 | $985,000 | 7 | 75 |
| Total: 5 · Average | 2.8 | 1.8 | 1,335.6 | 5,987.2 | $695 | $909,000 | 68.6 | |||
| Median | 1,333 | $920,000 | ||||||||
Closed Properties (5)
Closed Comparables
| Address | City | Year | Date | BD | BTH | SqFt | LotSz | LP | SP | SP/SqFt | SP/LP | DIM | Score |
|---|---|---|---|---|---|---|---|---|---|---|---|---|---|
| 5339 Thornburn Street | Los Angeles | 1949 | 06/30/2026 | 3 | 2 | 1,162 | 6,202 | $949,000 | $865,000 | $744 | 0.91 | 91 | 84 |
| 320 Hillsdale Avenue | Inglewood | 1939 | 09/28/2026 | 3 | 1 | 1,131 | 5,523 | $775,000 | $800,000 | $707 | 1.03 | 232 | 82 |
| 7832 Midfield Avenue | Los Angeles | 1950 | 10/15/2026 | 2 | 2 | 1,280 | 6,798 | $995,000 | $970,000 | $758 | 0.97 | 130 | 81 |
| 440 Ellis Avenue | Inglewood | 1936 | 10/08/2026 | 2 | 2 | 1,250 | 5,397 | $899,999 | $918,185 | $735 | 1.02 | 35 | 80 |
| 5567 West 79th Street | Los Angeles | 1950 | 07/28/2026 | 2 | 1 | 1,140 | 5,581 | $999,000 | $997,450 | $875 | 1.00 | 50 | 76 |
| Total: 5 · Average | 2.4 | 1.6 | 1,192.6 | 5,900.2 | $910,127 | $910,127 | $763.8 | — | 107.6 | ||||
| Median | 1,162 | $918,185 | $918,185 | ||||||||||
Market Analysis
List vs Sale $/SqFt
Sale Price Trend
Days on Market
Sale vs List Price
This analysis was generated automatically from MLS data. For an in-depth, human-reviewed valuation, contact Joseph Sardella at josephsardella@gmail.com.