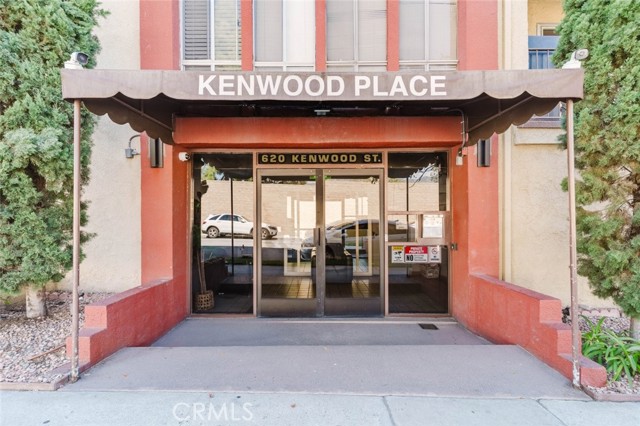
620 North Kenwood Street, 208, Glendale, CA 91206
620 North Kenwood Street, 208, Glendale, CA 91206
Property Description
This 2-bedroom, 2-bathroom condo offers 1,054 square feet of living space in Glendale. The spacious living areas feature light laminate wood-style flooring, recessed lighting, ceiling fans, and ample closet space. The kitchen has been refreshed with new cabinetry and finishes, white appliances, and new lighting. A private balcony provides additional outdoor space. The community offers a pool, spa, outdoor cooking and barbecue area, community laundry, and community parking. HOA includes water and trash. Located in Glendale with convenient access to local shopping, dining, entertainment, and transportation.
Features & Amenities
Property Details
Mortgage Calculator
Current Rates
Comparative Market Analysis
Affordable Tier · 5 active · 5 closed
Glendale · Condominium
Listed 8.3% below the median closed sale of $600,000.
Price Position
Priced below the market — value advantage over the field.
Active Properties (5)
Active Comparables
| Address | City | Year | BD | BTH | SqFt | LotSz | LP/SqFt | LP | DIM | Score |
|---|---|---|---|---|---|---|---|---|---|---|
| 310 Jackson Street | Glendale | 1973 | 2 | 1 | 859 | 44,257 | $576 | $495,000 | 32 | 86 |
| 618 Howard Street | Glendale | 1988 | 2 | 2 | 905 | 43,261 | $680 | $615,000 | 109 | 86 |
| 515 Jackson | Glendale | 1975 | 1 | 1 | 800 | 22,411 | $594 | $475,000 | 18 | 84 |
| 215 Kenwood Street | Glendale | 1963 | 2 | 1 | 927 | 22,578 | $512 | $475,000 | 38 | 81 |
| 515 Jackson Street | Glendale | 1975 | 1 | 1 | 680 | 22,404 | $703 | $478,000 | 41 | 81 |
| Total: 5 · Average | 1.6 | 1.2 | 834.2 | 30,982.2 | $613 | $507,600 | 47.6 | |||
| Median | 859 | $478,000 | ||||||||
Closed Properties (5)
Closed Comparables
| Address | City | Year | Date | BD | BTH | SqFt | LotSz | LP | SP | SP/SqFt | SP/LP | DIM | Score |
|---|---|---|---|---|---|---|---|---|---|---|---|---|---|
| 330 Howard Street | Glendale | 1962 | 07/10/2026 | 2 | 2 | 997 | 22,320 | $499,000 | $470,000 | $471 | 0.94 | 79 | 88 |
| 500 Jackson Place | Glendale | 1973 | 01/05/2026 | 2 | 2 | 1,137 | 45,564 | $599,900 | $600,000 | $528 | 1.00 | 119 | 87 |
| 330 Jackson Street | Glendale | 1973 | 11/24/2025 | 2 | 1 | 1,009 | 44,263 | $550,000 | $560,000 | $555 | 1.02 | 61 | 84 |
| 310 Jackson Street | Glendale | 1973 | 12/15/2025 | 2 | 2 | 1,134 | 44,263 | $614,900 | $610,000 | $538 | 0.99 | 237 | 83 |
| 316 Maryland Avenue | Glendale | 1975 | 12/09/2025 | 2 | 2 | 1,305 | 26,711 | $625,000 | $632,500 | $485 | 1.01 | 91 | 83 |
| Total: 5 · Average | 2.0 | 1.8 | 1,116.4 | 36,624.2 | $574,500 | $574,500 | $515.4 | — | 117.4 | ||||
| Median | 1,134 | $600,000 | $600,000 | ||||||||||
Market Analysis
List vs Sale $/SqFt
Sale Price Trend
Days on Market
Sale vs List Price
This analysis was generated automatically from MLS data. For an in-depth, human-reviewed valuation, contact Joseph Sardella at josephsardella@gmail.com.