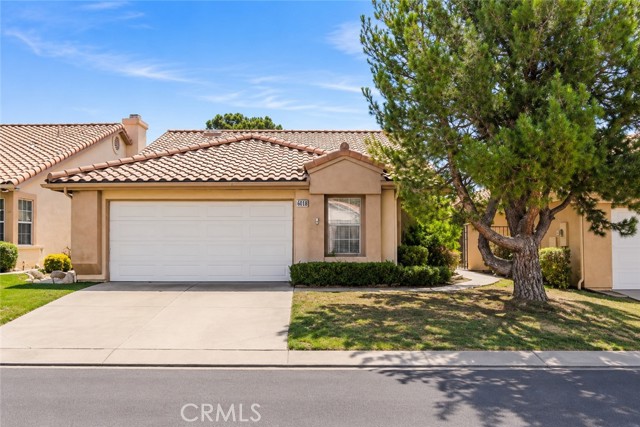
6018 Eagle Trace Lane, Banning, CA 92220
6018 Eagle Trace Lane, Banning, CA 92220
Property Description
Located in the desirable Sun Lakes gated community, this home offers an opportunity to enjoy the community's amenities and convenient Banning location. The property features a functional floor plan, comfortable living spaces, and a private outdoor area. The home would benefit from interior cleaning, carpet cleaning, and some landscaping maintenance to restore its overall appeal. Offering an opportunity for a new owner to enhance the outdoor space. A great opportunity for buyers looking to personalize a home and add their own touches in an established community.
Features & Amenities
Property Details
Mortgage Calculator
Current Rates
Comparative Market Analysis
Affordable Tier · 2 active · 5 closed
Not Applicable · Banning · Single Family Residence
Listed in line with the median closed sale of $265,000. Expect a longer timeline — comps averaged 131 days on market.
Price Position
Aligned with the market — fair pricing for the comps.
Active Properties (2)
Active Comparables
| Address | City | Year | BD | BTH | SqFt | LotSz | LP/SqFt | LP | DIM | Score |
|---|---|---|---|---|---|---|---|---|---|---|
| 1107 Pauma Valley | Banning | 1988 | 3 | 2 | 1,298 | 6,098 | $239 | $310,000 | 25 | 90 |
| 222 Dawn Way | Banning | 1980 | 2 | 1 | 891 | 4,356 | $331 | $295,000 | 53 | 73 |
| Total: 2 · Average | 2.5 | 1.5 | 1,094.5 | 5,227 | $285 | $302,500 | 39 | |||
| Median | 1,298 | $310,000 | ||||||||
Closed Properties (5)
Closed Comparables
| Address | City | Year | Date | BD | BTH | SqFt | LotSz | LP | SP | SP/SqFt | SP/LP | DIM | Score |
|---|---|---|---|---|---|---|---|---|---|---|---|---|---|
| 6357 Player Court | Banning | 1988 | 11/05/2026 | 2 | 2 | 1,007 | 4,792 | $255,000 | $262,325 | $261 | 1.03 | 14 | 89 |
| 6351 Spyglass | Banning | 1989 | 06/24/2026 | 3 | 2 | 1,195 | 4,792 | $307,000 | $307,000 | $257 | 1.00 | 261 | 89 |
| 980 Oakland Hills | Banning | 1989 | 06/26/2026 | 3 | 2 | 1,195 | 4,356 | $298,888 | $260,000 | $218 | 0.87 | 63 | 87 |
| 962 Oakland Hills Drive | Banning | 1989 | 09/09/2026 | 3 | 2 | 1,285 | 4,356 | $295,000 | $265,000 | $206 | 0.90 | 125 | 86 |
| 658 Torrey Pines | Banning | 1987 | 05/15/2026 | 3 | 2 | 1,312 | 4,792 | $315,000 | $302,500 | $231 | 0.96 | 193 | 86 |
| Total: 5 · Average | 2.8 | 2.0 | 1,198.8 | 4,617.6 | $279,365 | $279,365 | $234.6 | — | 131.2 | ||||
| Median | 1,195 | $265,000 | $265,000 | ||||||||||
Market Analysis
List vs Sale $/SqFt
Sale Price Trend
Days on Market
Sale vs List Price
This analysis was generated automatically from MLS data. For an in-depth, human-reviewed valuation, contact Joseph Sardella at josephsardella@gmail.com.