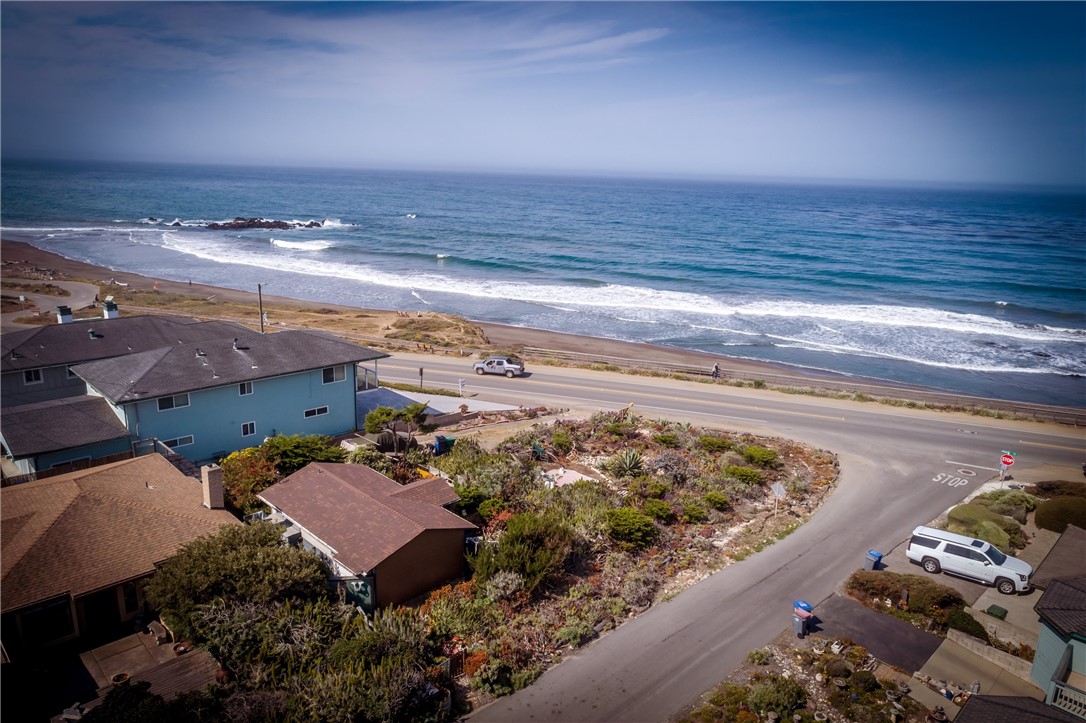
5978 Moonstone Beach Drive, Cambria, CA 93428
5978 Moonstone Beach Drive, Cambria, CA 93428
Property Description
The Corner Cottage at Moonstone Beach Drive. Panoramic Unblockable Ocean Views. A Perfect Fixer Upper Opportunity or Build Your New Cambria Dream Home on this oversize level corner double lot (+-6432sqft). Step out your front door to the beach and boardwalk. A short walk to Moonstone Beach restaurants and Leffingwell Landing. Sunsets at the Beach every evening. A Rare Offering on much sought after Moonstone Beach Drive. Call your Realtor Today!
Features & Amenities
Property Details
Mortgage Calculator
Current Rates
About Cambria
This property is located in Cambria, a community in Cambria. Explore more listings in this neighborhood to compare options and pricing.
View Cambria ListingsComparative Market Analysis
Luxury Tier · 4 active · 5 closed
Cambria · Cambria · Single Family Residence
Listed in line with the median closed sale of $1,850,000. Price per sqft ($3,854) is a 439% premium to closed comps ($715). Luxury tier — fewer comparable sales widen the confidence range.
Price Position
Aligned with the market — fair pricing for the comps.
Active Properties (4)
Active Comparables
| Address | City | Year | BD | BTH | SqFt | LotSz | LP/SqFt | LP | DIM | Score |
|---|---|---|---|---|---|---|---|---|---|---|
| 1021 Hillcrest | Cambria | 1982 | 3 | 3 | 2,360 | 47,750 | $676 | $1.59M | 396 | 54 |
| 565 Chiswick Way | Cambria | 1987 | 4 | 5 | 2,195 | 40,345 | $911 | $2.00M | 74 | 47 |
| 305 Ivar Street | Cambria | 2005 | 3 | 4 | 2,303 | 3,850 | $868 | $2.00M | 51 | 46 |
| 1919 Richard Avenue | Cambria | 2001 | 3 | 3 | 2,244 | 13,225 | $798 | $1.79M | 183 | 40 |
| Total: 4 · Average | 3.3 | 3.8 | 2,275.5 | 26,292.5 | $813.25 | $1.85M | 176 | |||
| Median | 2,303 | $2.00M | ||||||||
Closed Properties (5)
Closed Comparables
| Address | City | Year | Date | BD | BTH | SqFt | LotSz | LP | SP | SP/SqFt | SP/LP | DIM | Score |
|---|---|---|---|---|---|---|---|---|---|---|---|---|---|
| 2295 Benson Avenue | Cambria | 1995 | 10/09/2026 | 4 | 3 | 3,598 | 7,800 | $2.00M | $2.07M | $575 | 1.04 | 34 | 58 |
| 5320 Windsor Boulevard | Cambria | 1978 | 11/12/2026 | 3 | 3 | 2,105 | 3,500 | $1.66M | $1.62M | $770 | 0.98 | 108 | 57 |
| 390 Lampton | Cambria | 1994 | 07/17/2026 | 3 | 3 | 2,253 | 6,150 | $1.70M | $1.59M | $706 | 0.94 | 119 | 50 |
| 2111 Windsor Boulevard | Cambria | 1998 | 07/07/2026 | 3 | 4 | 2,340 | 5,300 | $2.10M | $1.98M | $844 | 0.94 | 42 | 48 |
| 1850 Laurel | Cambria | 1996 | 02/23/2026 | 3 | 4 | 2,721 | 6,187 | $1.85M | $1.85M | $680 | 1.00 | 35 | 47 |
| Total: 5 · Average | 3.2 | 3.4 | 2,603.4 | 5,787.4 | $1.82M | $1.82M | $715 | — | 67.6 | ||||
| Median | 2,340 | $1.85M | $1.85M | ||||||||||
Market Analysis
List vs Sale $/SqFt
Sale Price Trend
Days on Market
Sale vs List Price
This analysis was generated automatically from MLS data. For an in-depth, human-reviewed valuation, contact Joseph Sardella at josephsardella@gmail.com.