1 / 8
5960 Coffee, Hesperia, CA 92345
$646K3bd · 3ba · 2,257 sqft
Lot 7,580 sqft•HOA $157/mo•Single Family Residence•Active•6d on market•MLS# OC-26241895
5960 Coffee, Hesperia, CA 92345
MLS# OC-26241895•Residential•Single Family Residence
Active6 days on market
$645,900
3
Beds
3
Baths
2,257
Sq Ft
7,580
Lot Sq Ft
$157
HOA/mo
2025
Year Built
Mountain(s)
View
Property Description
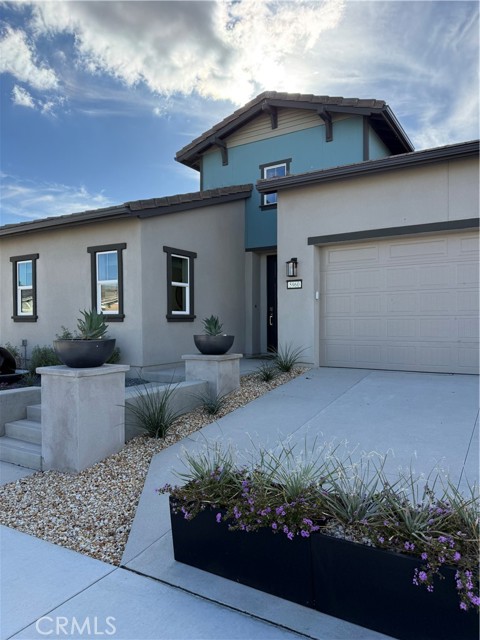
This gorgeous Model Home Plan 1 is completely move-in ready, featuring high-end upgrades and designer furniture—all included in the price. There are too many custom details to list, so come see this beauty in person before it’s gone!
Features & Amenities
FeeBuilt 2025
Property Details
Land Type
Fee
Year Built
2025
Property Type
Residential
Property Subtype
Single Family Residence
Parking Spaces
2
Garage Spaces
2
Heating
Central
Cooling
Central Air
View
Mountain(s)
City
Hesperia
Zip Code
92345
County
San Bernardino
Mortgage Calculator
Current Rates
$
$
%
Monthly Payment
$3,266.02
Principal & Interest
Loan Amount
$516,720
Total Interest
$659,048
Total Payment Over 30 Years
$1,175,768
This calculator provides estimates only. Actual mortgage payments may include taxes, insurance, HOA fees, and PMI. Contact a lender for accurate quotes.
Comparative Market Analysis
Residential Tier · 5 active · 5 closed
5960 Coffee, Hesperia, CA 92345
Hesperia · Single Family Residence
$646K
Residential TierBeds
3
Baths
3
Sqft
2,257
Lot
7,580 sqft
Year
2025
$/Sqft
$286
Pool: No✓
View: mountain✓
Garage: 2-car✓
Listed 12.7% above the median closed sale of $573,280. Price per sqft ($286) is a 14% premium to closed comps ($251). Closed comps sold at 101% of list — strong seller's market. Expect a longer timeline — comps averaged 129 days on market.
Price Position
Positioned above the market — commands a premium.
Premium
Subject listed at $646K· $286/sqft
Total list price
Closed comps
vs closed median $573K
+$73K (+12.7%)
Active comps
vs active median $599K
+$47K (+7.8%)
Price per sqft
Closed compsinsufficient comp data
Active comps
vs active avg $/sqft $248
+$38 (+15.4%)
Active Properties (5)
Active Comparables
| Address | City | Year | BD | BTH | SqFt | LotSz | LP/SqFt | LP | DIM | Score |
|---|---|---|---|---|---|---|---|---|---|---|
| 6446 Marblebrook | Hesperia | 2026 | 3 | 3 | 2,247 | 7,628 | $267 | $599,240 | 61 | 87 |
| 6470 Marblebrook | Hesperia | 2026 | 3 | 3 | 2,247 | 7,671 | $275 | $618,030 | 61 | 86 |
| 6413 Sierra City Avenue | Hesperia | 2026 | 3 | 3 | 2,377 | 6,500 | $236 | $560,992 | 89 | 84 |
| 6438 Castle Crags Avenue | Hesperia | 2025 | 4 | 3 | 2,377 | 6,501 | $236 | $561,065 | 291 | 79 |
| 6458 Marlebrook | Hesperia | 2026 | 4 | 4 | 3,018 | 7,664 | $225 | $678,920 | 60 | 77 |
| Total: 5 · Average | 3.4 | 3.2 | 2,453.2 | 7,192.8 | $247.8 | $603,649.4 | 112.4 | |||
| Median | 2,377 | $599,240 | ||||||||
Closed Properties (5)
Closed Comparables
| Address | City | Year | Date | BD | BTH | SqFt | LotSz | LP | SP | SP/SqFt | SP/LP | DIM | Score |
|---|---|---|---|---|---|---|---|---|---|---|---|---|---|
| 17127 Kent Street | Hesperia | 2026 | 07/02/2026 | 3 | 3 | 2,247 | 11,292 | $573,280 | $573,280 | $255 | 1.00 | 112 | 87 |
| 17209 Harpers Ferry | Hesperia | 2025 | 01/16/2026 | 4 | 3 | 2,215 | 6,534 | $582,200 | $572,200 | $258 | 0.98 | 142 | 86 |
| 6435 Castle Crags | Hesperia | 2026 | 09/29/2026 | 3 | 3 | 2,220 | 6,591 | $578,949 | $604,951 | $273 | 1.04 | 43 | 85 |
| 17313 Whiskey Meadows | Hesperia | 2026 | 09/30/2026 | 4 | 4 | 2,215 | 6,509 | $551,495 | $551,495 | $249 | 1.00 | 44 | 83 |
| 8802 Waltham Street | Hesperia | 2025 | 07/30/2026 | 4 | 3 | 2,650 | 8,787 | $581,425 | $581,928 | $220 | 1.00 | 303 | 81 |
| Total: 5 · Average | 3.6 | 3.2 | 2,309.4 | 7,942.6 | $576,770.8 | $576,770.8 | $251 | — | 128.8 | ||||
| Median | 2,220 | $573,280 | $573,280 | ||||||||||
Market Analysis
List vs Sale $/SqFt
Sale Price Trend
Days on Market
Sale vs List Price
AI-generated CMA
This analysis was generated automatically from MLS data. For an in-depth, human-reviewed valuation, contact Joseph Sardella at josephsardella@gmail.com.