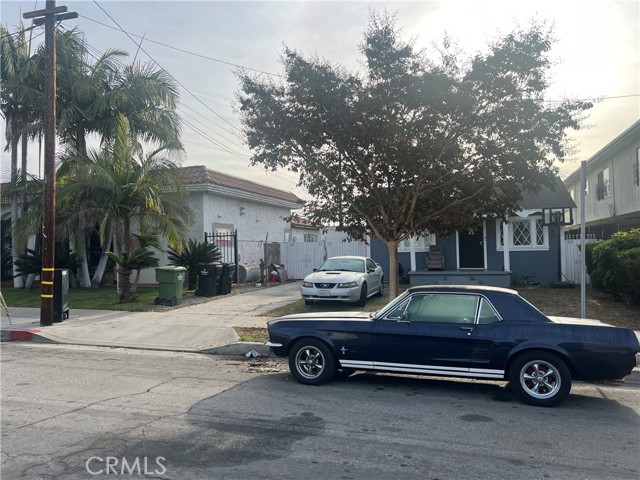
542 Short Street, Inglewood, CA 90302
542 Short Street, Inglewood, CA 90302
Property Description
Location Location 3 bedroom 1 bath R-3 located in Inglewood City of Champions, just minutes from top attractions including Ladera Heights shopping center Westfield shopping center the Kia Forum, YouTube Theater, SoyFi Stadium, Intuit Dome, LAX, and Hollywood Park Casino, convenient access to dining, and major freeways 405,105 fwy Sold As-Is
Features & Amenities
Property Details
Mortgage Calculator
Current Rates
Comparative Market Analysis
Affordable Tier · 5 active · 5 closed
Inglewood · Single Family Residence
Listed in line with the median closed sale of $1,120,000. Price per sqft ($872) is a 18% premium to closed comps ($742). Closed comps sold at 100% of list — strong seller's market.
Price Position
Aligned with the market — fair pricing for the comps.
Active Properties (5)
Active Comparables
| Address | City | Year | BD | BTH | SqFt | LotSz | LP/SqFt | LP | DIM | Score |
|---|---|---|---|---|---|---|---|---|---|---|
| 404 Hillsdale Street | Inglewood | 1938 | 4 | 2 | 1,450 | 5,407 | $759 | $1.10M | 24 | 85 |
| 6235 Condon Avenue | Los Angeles | 1948 | 2 | 2 | 1,412 | 7,707 | $885 | $1.25M | 2 | 79 |
| 5282 Thornburn Street | Los Angeles | 1951 | 4 | 2 | 1,508 | 8,400 | $795 | $1.20M | 3 | 74 |
| 7361 Flight Avenue | Los Angeles | 1987 | 2 | 2 | 1,836 | 6,000 | $531 | $975,000 | 44 | 70 |
| 332 Plymouth Street | Inglewood | 1951 | 3 | 2 | 1,650 | 6,752 | $576 | $950,000 | 100 | 70 |
| Total: 5 · Average | 3.0 | 2.0 | 1,571.2 | 6,853.2 | $709.2 | $1.09M | 34.6 | |||
| Median | 1,508 | $1.10M | ||||||||
Closed Properties (5)
Closed Comparables
| Address | City | Year | Date | BD | BTH | SqFt | LotSz | LP | SP | SP/SqFt | SP/LP | DIM | Score |
|---|---|---|---|---|---|---|---|---|---|---|---|---|---|
| 337 Hillsdale | Inglewood | 1939 | 05/12/2026 | 3 | 2 | 1,312 | 5,779 | $1.05M | $1.15M | $877 | 1.10 | 48 | 82 |
| 5283 Thornburn Street | Los Angeles | 1950 | 06/26/2026 | 3 | 2 | 1,362 | 6,853 | $1.13M | $1.12M | $822 | 1.00 | 75 | 79 |
| 7014 Ramsgate Avenue | Los Angeles | 1950 | 07/10/2026 | 3 | 2 | 1,452 | 8,052 | $1.35M | $1.25M | $861 | 0.93 | 50 | 78 |
| 308 Ellis Avenue | Inglewood | 1927 | 06/05/2026 | 3 | 2 | 1,956 | 6,187 | $1.07M | $1.08M | $553 | 1.01 | 149 | 73 |
| 6919 Knowlton Place | Los Angeles | 2021 | 10/29/2026 | 3 | 4 | 1,777 | 1,522 | $1.06M | $1.06M | $596 | 1.00 | 76 | 69 |
| Total: 5 · Average | 3.0 | 2.4 | 1,571.8 | 5,678.6 | $1.13M | $1.13M | $741.8 | — | 79.6 | ||||
| Median | 1,452 | $1.12M | $1.12M | ||||||||||
Market Analysis
List vs Sale $/SqFt
Sale Price Trend
Days on Market
Sale vs List Price
This analysis was generated automatically from MLS data. For an in-depth, human-reviewed valuation, contact Joseph Sardella at josephsardella@gmail.com.