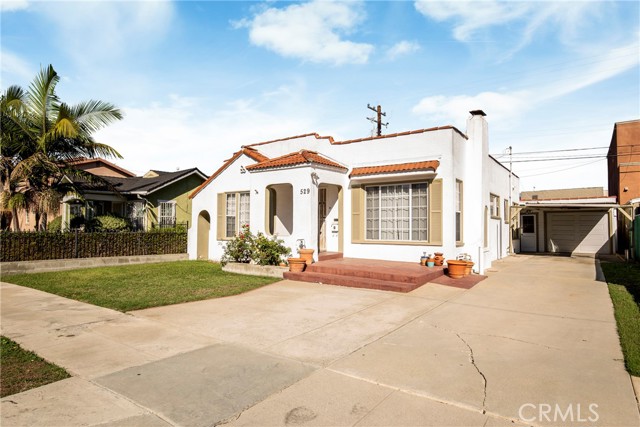
529 West Olive Street, Inglewood, CA 90301
529 West Olive Street, Inglewood, CA 90301
Property Description
Welcome to 529 W Olive Street, a single-family home in Inglewood featuring 3 bedrooms and 2 bathrooms on an approximately 4,232-square-foot lot. Built in 1926, this property offers an opportunity to add your personal touches and make it your own. Conveniently located near downtown Inglewood’s shops and dining, with access to SoFi Stadium, the Kia Forum, Intuit Dome, LAX and major freeways. Offered as-is. Buyer to verify square footage, bedroom and bathroom count, and permit status.
Features & Amenities
Property Details
Mortgage Calculator
Current Rates
Comparative Market Analysis
Affordable Tier · 5 active · 5 closed
Inglewood · Single Family Residence
Listed 8.9% above the median closed sale of $730,000. Closed comps sold at 92% of list — buyers have negotiating leverage.
Price Position
Positioned above the market — commands a premium.
Active Properties (5)
Active Comparables
| Address | City | Year | BD | BTH | SqFt | LotSz | LP/SqFt | LP | DIM | Score |
|---|---|---|---|---|---|---|---|---|---|---|
| 918 Oak Street | Inglewood | 1966 | 3 | 2 | 1,272 | 3,750 | $625 | $795,000 | 144 | 82 |
| 4134 107th | Inglewood | 1925 | 3 | 2 | 1,143 | 4,166 | $661 | $755,000 | 80 | 81 |
| 1135 Larch | Inglewood | 1922 | 2 | 1 | 1,188 | 3,474 | $572 | $680,000 | 33 | 80 |
| 624 Beach Avenue | Inglewood | 1949 | 4 | 2 | 1,182 | 4,390 | $761 | $899,900 | 79 | 79 |
| 1315 Field Avenue | Inglewood | 1947 | 2 | 2 | 984 | 2,553 | $700 | $689,000 | 16 | 74 |
| Total: 5 · Average | 2.8 | 1.8 | 1,153.8 | 3,666.6 | $663.8 | $763,780 | 70.4 | |||
| Median | 1,182 | $755,000 | ||||||||
Closed Properties (5)
Closed Comparables
| Address | City | Year | Date | BD | BTH | SqFt | LotSz | LP | SP | SP/SqFt | SP/LP | DIM | Score |
|---|---|---|---|---|---|---|---|---|---|---|---|---|---|
| 522 Hillcrest Boulevard | Inglewood | 1924 | 07/01/2026 | 3 | 2 | 954 | 5,016 | $735,000 | $700,000 | $734 | 0.95 | 75 | 88 |
| 425 Elm | Inglewood | 1941 | 04/21/2026 | 3 | 2 | 1,112 | 4,554 | $1.05M | $872,000 | $784 | 0.83 | 75 | 83 |
| 524 Magnolia Avenue | Inglewood | 1929 | 06/01/2026 | 2 | 1 | 1,124 | 4,845 | $725,000 | $725,000 | $645 | 1.00 | 118 | 80 |
| 205 Hardy Street | Inglewood | 1927 | 09/24/2026 | 2 | 2 | 1,539 | 5,146 | $799,900 | $730,000 | $474 | 0.91 | 103 | 80 |
| 5339 Thornburn Street | Los Angeles | 1949 | 06/30/2026 | 3 | 2 | 1,162 | 6,202 | $949,000 | $865,000 | $744 | 0.91 | 91 | 77 |
| Total: 5 · Average | 2.6 | 1.8 | 1,178.2 | 5,152.6 | $778,400 | $778,400 | $676.2 | — | 92.4 | ||||
| Median | 1,124 | $730,000 | $730,000 | ||||||||||
Market Analysis
List vs Sale $/SqFt
Sale Price Trend
Days on Market
Sale vs List Price
This analysis was generated automatically from MLS data. For an in-depth, human-reviewed valuation, contact Joseph Sardella at josephsardella@gmail.com.