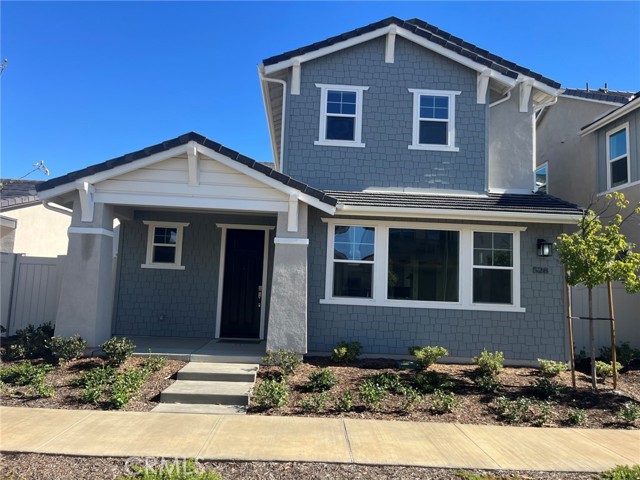
528 San Lorenzo Road, Ventura, CA 93004
528 San Lorenzo Road, Ventura, CA 93004
Property Description
Beautiful brand new home within minutes to the beach! This 2-level single family residence has 4 bedrooms with a private bedroom and bath suite on the main floor as well as a half bath. Upstairs is a loft which serves as a second living space. Beautiful primary bedroom suite with a generous size retreat and walk-in closet. Upstairs laundry. Open concept floor plan with upgraded quartz countertops and designer backsplash at kitchen. Kitchen island with breakfast bar. Built-in Kitchen appliances including refrigerator. Amenities include a community pool, spa and recreation center. HOA fees starting around $165 and estimated to be around $105 at build-out. Home is ready for move-in.
Features & Amenities
Property Details
Mortgage Calculator
Current Rates
Comparative Market Analysis
Residential Tier · 5 active · 5 closed
Not Applicable · Ventura · Single Family Residence
Listed 3.5% above the median closed sale of $1,074,895. Expect a longer timeline — comps averaged 137 days on market.
Price Position
Aligned with the market — fair pricing for the comps.
Active Properties (5)
Active Comparables
| Address | City | Year | BD | BTH | SqFt | LotSz | LP/SqFt | LP | DIM | Score |
|---|---|---|---|---|---|---|---|---|---|---|
| 543 San Lorenzo Road | Ventura | 2026 | 4 | 4 | 2,942 | 4,941 | $387 | $1.14M | 25 | 96 |
| 544 San Lorenzo Road | Ventura | 2026 | 4 | 4 | 2,855 | 5,112 | $393 | $1.12M | 2 | 96 |
| 541 Tracy Place | Ventura | 2026 | 4 | 3 | 2,464 | 3,835 | $393 | $969,000 | 73 | 94 |
| 164 S Nevada Avenue | Ventura | 2023 | 4 | 4 | 2,855 | 4,370 | $394 | $1.13M | 79 | 91 |
| 485 Tracy Place | Ventura | 2026 | 4 | 3 | 2,464 | 3,150 | $413 | $1.02M | 115 | 90 |
| Total: 5 · Average | 4.0 | 3.6 | 2,716 | 4,281.6 | $396 | $1.07M | 58.8 | |||
| Median | 2,855 | $1.12M | ||||||||
Closed Properties (5)
Closed Comparables
| Address | City | Year | Date | BD | BTH | SqFt | LotSz | LP | SP | SP/SqFt | SP/LP | DIM | Score |
|---|---|---|---|---|---|---|---|---|---|---|---|---|---|
| 10757 Citrus Drive | Ventura | 2026 | 10/07/2026 | 4 | 4 | 2,802 | 4,050 | $1.08M | $1.08M | $385 | 1.00 | 212 | 98 |
| 10765 Citrus Drive | Ventura | 2026 | 08/03/2026 | 4 | 4 | 2,855 | 4,180 | $1.10M | $1.07M | $376 | 0.98 | 147 | 96 |
| 407 Belair Walk | Ventura | 2026 | 08/21/2026 | 4 | 3 | 2,464 | 3,150 | $985,000 | $963,806 | $391 | 0.98 | 165 | 91 |
| 373 Nevada Avenue | Ventura | 2025 | 02/05/2026 | 4 | 3 | 2,464 | 3,150 | $990,000 | $981,000 | $398 | 0.99 | 51 | 86 |
| 615 Boston Avenue | Ventura | 2006 | 10/21/2026 | 4 | 4 | 2,515 | 6,234 | $1.08M | $1.07M | $427 | 0.99 | 110 | 85 |
| Total: 5 · Average | 4.0 | 3.6 | 2,620 | 4,152.8 | $1.03M | $1.03M | $395.4 | — | 137 | ||||
| Median | 2,515 | $1.07M | $1.07M | ||||||||||
Market Analysis
List vs Sale $/SqFt
Sale Price Trend
Days on Market
Sale vs List Price
This analysis was generated automatically from MLS data. For an in-depth, human-reviewed valuation, contact Joseph Sardella at josephsardella@gmail.com.