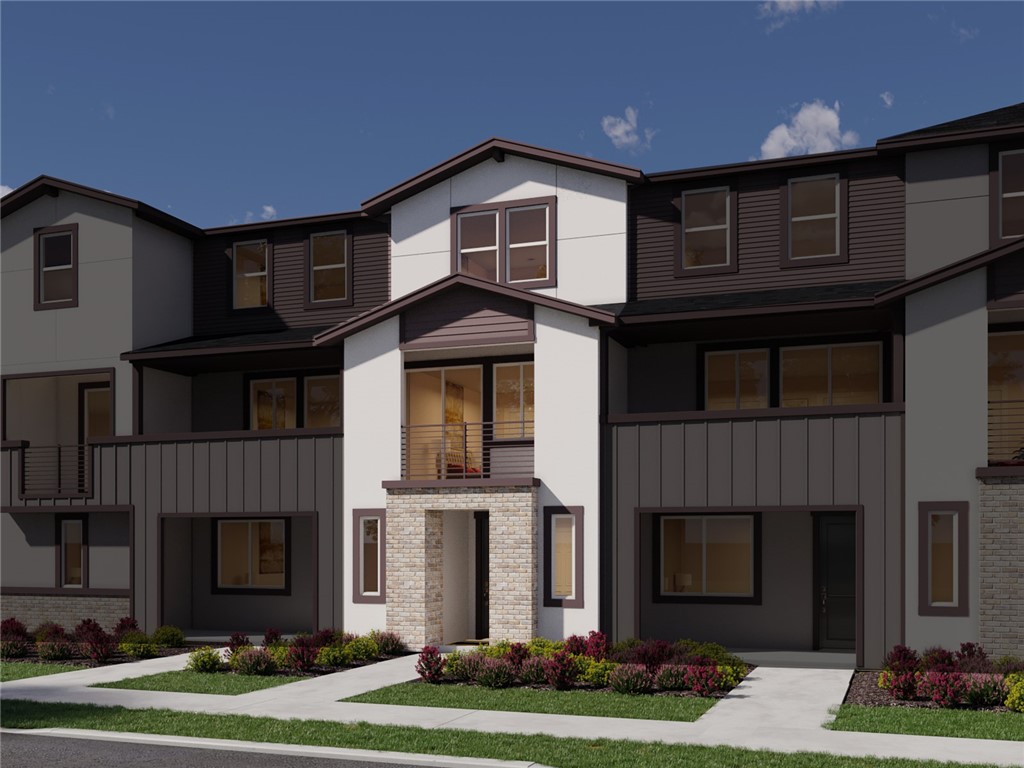
469 South Olive Street, Anaheim, CA 92805
469 South Olive Street, Anaheim, CA 92805
Property Description
Brand new, energy-efficient home available by Dec 2026! Now selling, The Mill is located in the heart of it all situated across from the popular Anaheim Packing District. These stylish townhomes offer spacious, open-concept floorplans, chef-inspired kitchens, primary suites with walk-in closets and covered decks. Homeowners will benefit from The Mill’s turnkey, move-in ready features such as included Whirlpool® appliances and whole home blinds. Each of our homes is built with innovative, energy-efficient features designed to help you enjoy more savings, better health, real comfort and peace of mind.
Features & Amenities
Property Details
Mortgage Calculator
Current Rates
Comparative Market Analysis
Affordable Tier · 5 active · 5 closed
Not Applicable · Anaheim · Condominium
Listed 9.7% above the median closed sale of $825,000. Price per sqft ($605) is a 20% premium to closed comps ($504). Closed comps sold at 100% of list — strong seller's market.
Price Position
Positioned above the market — commands a premium.
Active Properties (5)
Active Comparables
| Address | City | Year | BD | BTH | SqFt | LotSz | LP/SqFt | LP | DIM | Score |
|---|---|---|---|---|---|---|---|---|---|---|
| 383 Santa Ana Street | Anaheim | 2026 | 2 | 3 | 1,300 | 0 | $650 | $844,550 | 5 | 94 |
| 467 Olive Street | Anaheim | 2026 | 3 | 4 | 1,773 | 0 | $564 | $999,500 | 5 | 93 |
| 461 Olive Street | Anaheim | 2026 | 2 | 3 | 1,215 | 0 | $708 | $860,300 | 5 | 92 |
| 621 Melrose Street | Anaheim | 2010 | 3 | 3 | 2,049 | 0 | $439 | $899,000 | 66 | 84 |
| 755 Mosaic Street | Anaheim | 2020 | 4 | 4 | 2,004 | 21,062 | $462 | $925,000 | 78 | 78 |
| Total: 5 · Average | 2.8 | 3.4 | 1,668.2 | 21,062 | $564.6 | $905,670 | 31.8 | |||
| Median | 1,773 | $899,000 | ||||||||
Closed Properties (5)
Closed Comparables
| Address | City | Year | Date | BD | BTH | SqFt | LotSz | LP | SP | SP/SqFt | SP/LP | DIM | Score |
|---|---|---|---|---|---|---|---|---|---|---|---|---|---|
| 516 Casita | Anaheim | 2014 | 09/28/2026 | 3 | 3 | 1,653 | 25,313 | $799,900 | $825,000 | $499 | 1.03 | 60 | 89 |
| 574 Kroeger Street | Anaheim | 2014 | 06/23/2026 | 3 | 3 | 1,662 | 0 | $895,000 | $900,000 | $542 | 1.01 | 45 | 88 |
| 712 Olive | Anaheim | 2008 | 09/18/2026 | 4 | 3 | 1,760 | 28,097 | $879,999 | $850,000 | $483 | 0.97 | 57 | 85 |
| 813 Anaheim Boulevard | Anaheim | 2015 | 02/27/2026 | 3 | 3 | 1,540 | 0 | $799,000 | $805,000 | $523 | 1.01 | 36 | 84 |
| 677 District | Anaheim | 2019 | 01/15/2026 | 3 | 4 | 1,678 | 76,642 | $799,999 | $795,000 | $474 | 0.99 | 62 | 82 |
| Total: 5 · Average | 3.2 | 3.2 | 1,658.6 | 43,350.667 | $835,000 | $835,000 | $504.2 | — | 52 | ||||
| Median | 1,662 | $825,000 | $825,000 | ||||||||||
Market Analysis
List vs Sale $/SqFt
Sale Price Trend
Days on Market
Sale vs List Price
This analysis was generated automatically from MLS data. For an in-depth, human-reviewed valuation, contact Joseph Sardella at josephsardella@gmail.com.