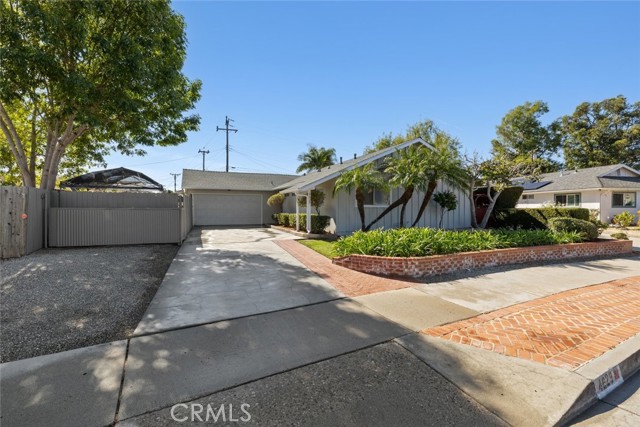
4629 Tajo, Santa Barbara, CA 93110
4629 Tajo, Santa Barbara, CA 93110
Property Description
Well maintained beauty with a great flexible floor plan. Enjoy the utility of 4 bedrooms or 3 bedrooms with a primary bedroom ensuite or a connected office. A must see. New electrical panel, fresh paint, recessed lighting and much more! RV parking with extra storage sheds. A fully landscaped backyard oasis awaits. Wonderful neighborhood, with local retail, restaurants, San Marcos High School, and easy drive to Santa Barbara City & Goleta. Come see this move in ready beauty!
Features & Amenities
Property Details
Mortgage Calculator
Current Rates
About Santa Barbara
This property is located in Santa Barbara, a community in Santa Barbara. Explore more listings in this neighborhood to compare options and pricing.
View Santa Barbara ListingsComparative Market Analysis
Affordable Tier · 0 active · 5 closed
Santa Barbara · Santa Barbara · Single Family Residence
Listed in line with the median closed sale of $1,475,000. Price per sqft ($1,034) is a 28% premium to closed comps ($806). Closed comps sold at 100% of list — strong seller's market.
Price Position
Aligned with the market — fair pricing for the comps.
Closed Properties (5)
Closed Comparables
| Address | City | Year | Date | BD | BTH | SqFt | LotSz | LP | SP | SP/SqFt | SP/LP | DIM | Score |
|---|---|---|---|---|---|---|---|---|---|---|---|---|---|
| 150 La Venta | Santa Barbara | 1961 | 11/26/2025 | 4 | 3 | 1,996 | 6,098 | $1.32M | $1.35M | $676 | 1.02 | 25 | 78 |
| 655 Camino Campana | Santa Barbara | 1963 | 05/15/2026 | 4 | 2 | 1,511 | 9,148 | $1.45M | $1.48M | $976 | 1.02 | 38 | 66 |
| 122 Kinman Avenue | Goleta | 1957 | 11/25/2025 | 3 | 2 | 1,500 | 6,534 | $1.25M | $1.25M | $830 | 1.00 | 22 | 63 |
| 740 Walnut Lane | Santa Barbara | 1959 | 04/21/2026 | 5 | 3 | 2,046 | 6,098 | $1.50M | $1.49M | $728 | 0.99 | 306 | 60 |
| 5325 Orchard Park Lane | Goleta | 2002 | 02/20/2026 | 3 | 2 | 1,832 | 4,356 | $1.50M | $1.50M | $819 | 1.00 | 27 | 55 |
| Total: 5 · Average | 3.8 | 2.4 | 1,777 | 6,446.8 | $1.41M | $1.41M | $805.8 | — | 83.6 | ||||
| Median | 1,832 | $1.48M | $1.48M | ||||||||||
Market Analysis
List vs Sale $/SqFt
Sale Price Trend
Days on Market
Sale vs List Price
This analysis was generated automatically from MLS data. For an in-depth, human-reviewed valuation, contact Joseph Sardella at josephsardella@gmail.com.