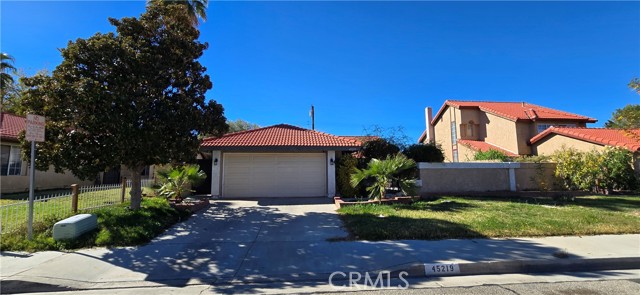
45219 Thornwood Avenue, Lancaster, CA 93534
45219 Thornwood Avenue, Lancaster, CA 93534
Property Description
Spacious 3-bedroom, 2-bath home featuring a formal dining room, inviting living room, and comfortable family room. Enjoy your morning coffee and breakfast on the charming front patio, the perfect spot to start your day. This home also includes solar panels for energy savings and an alkaline water softening system for added comfort and convenience. A wonderful combination of space, functionality, and modern amenities.
Features & Amenities
Property Details
Mortgage Calculator
Current Rates
Comparative Market Analysis
Affordable Tier · 5 active · 5 closed
Lancaster · Single Family Residence
Listed in line with the median closed sale of $420,000. Price per sqft ($248) is a 10% discount to closed comps ($277). Closed comps sold at 101% of list — strong seller's market.
Price Position
Aligned with the market — fair pricing for the comps.
Active Properties (5)
Active Comparables
| Address | City | Year | BD | BTH | SqFt | LotSz | LP/SqFt | LP | DIM | Score |
|---|---|---|---|---|---|---|---|---|---|---|
| 45533 Pickford | Lancaster | 1990 | 3 | 2 | 1,517 | 5,968 | $283 | $430,000 | 9 | 92 |
| 1432 Avenue H-13 | Lancaster | 1955 | 4 | 2 | 1,573 | 6,238 | $238 | $375,000 | 10 | 83 |
| 1469 Boyden | Lancaster | 1955 | 3 | 2 | 1,594 | 6,733 | $251 | $399,999 | 74 | 83 |
| 45420 Fairbanks | Lancaster | 2000 | 4 | 2 | 1,791 | 6,085 | $245 | $438,900 | 137 | 82 |
| 1444 Ivesbrook Street | Lancaster | 1953 | 3 | 2 | 1,242 | 7,597 | $336 | $417,000 | 13 | 79 |
| Total: 5 · Average | 3.4 | 2.0 | 1,543.4 | 6,524.2 | $270.6 | $412,179.8 | 48.6 | |||
| Median | 1,573 | $417,000 | ||||||||
Closed Properties (5)
Closed Comparables
| Address | City | Year | Date | BD | BTH | SqFt | LotSz | LP | SP | SP/SqFt | SP/LP | DIM | Score |
|---|---|---|---|---|---|---|---|---|---|---|---|---|---|
| 45539 York Place | Lancaster | 1986 | 08/26/2026 | 3 | 2 | 1,373 | 6,238 | $410,000 | $420,000 | $306 | 1.02 | 83 | 90 |
| 45312 Essex | Lancaster | 1985 | 09/21/2026 | 4 | 2 | 1,646 | 7,250 | $395,900 | $400,000 | $243 | 1.01 | 52 | 90 |
| 45102 Camolin Avenue | Lancaster | 1980 | 10/29/2026 | 3 | 2 | 1,829 | 7,566 | $449,900 | $450,000 | $246 | 1.00 | 27 | 88 |
| 45428 13th | Lancaster | 1957 | 07/01/2026 | 3 | 2 | 1,561 | 6,158 | $440,000 | $440,000 | $282 | 1.00 | 110 | 86 |
| 45208 17th | Lancaster | 1963 | 08/04/2026 | 3 | 2 | 1,269 | 6,892 | $385,000 | $390,000 | $307 | 1.01 | 143 | 86 |
| Total: 5 · Average | 3.2 | 2.0 | 1,535.6 | 6,820.8 | $420,000 | $420,000 | $276.8 | — | 83 | ||||
| Median | 1,561 | $420,000 | $420,000 | ||||||||||
Market Analysis
List vs Sale $/SqFt
Sale Price Trend
Days on Market
Sale vs List Price
This analysis was generated automatically from MLS data. For an in-depth, human-reviewed valuation, contact Joseph Sardella at josephsardella@gmail.com.