1 / 20
43008 39th West, Lancaster, CA 93536
$385K3bd · 1ba · 936 sqft
Lot 6,884 sqft•Single Family Residence•Active•182d on market•MLS# IN-26104861
43008 39th West, Lancaster, CA 93536
MLS# IN-26104861•Residential•Single Family Residence
Active182 days on market
$385,000
3
Beds
1
Baths
936
Sq Ft
6,884
Lot Sq Ft
1970
Year Built
None
View
Property Description
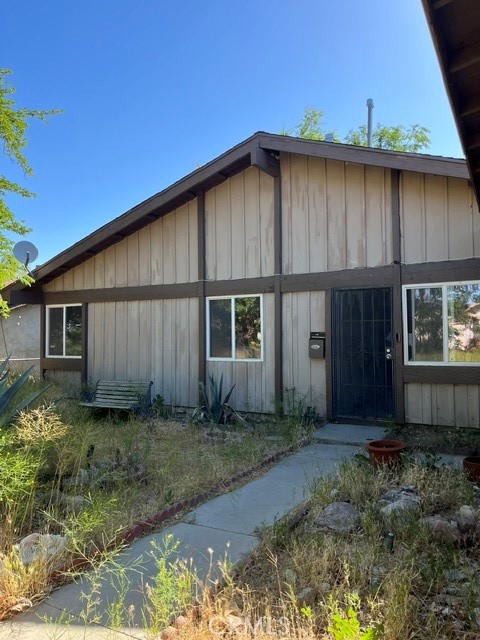
This Property needs new paint and carpet. The structure is in good condition and there are no issues with the roof, plumbing or electrical. In fact, the owner, who passed away just 1 year after purchasing the house, put in new electrical. The front and back yard are large and there is a bonus room/structure in the backyard.
Features & Amenities
FeeBuilt 1970
Property Details
Land Type
Fee
Year Built
1970
Property Type
Residential
Property Subtype
Single Family Residence
Parking Spaces
2
Garage Spaces
2
Cooling
None
View
None
City
Lancaster
Zip Code
93536
County
Los Angeles
Mortgage Calculator
Current Rates
$
$
%
Monthly Payment
$1,946.77
Principal & Interest
Loan Amount
$308,000
Total Interest
$392,837
Total Payment Over 30 Years
$700,837
This calculator provides estimates only. Actual mortgage payments may include taxes, insurance, HOA fees, and PMI. Contact a lender for accurate quotes.
Comparative Market Analysis
Affordable Tier · 5 active · 5 closed
43008 39th West, Lancaster, CA 93536
Lancaster · Single Family Residence
$385K
Affordable TierBeds
3
Baths
1
Sqft
936
Lot
6,884 sqft
Year
1970
$/Sqft
$411
Pool: No✓
View: None✓
Garage: 2-car✓
Listed 6.1% below the median closed sale of $410,000. Closed comps sold at 102% of list — strong seller's market.
Price Position
Priced below the market — value advantage over the field.
Price advantage
Subject listed at $385K· $411/sqft
Total list price
Closed comps
vs closed median $410K
−$25K (−6.1%)
Active comps
vs active median $405K
−$20K (−4.9%)
Price per sqft
Closed compsinsufficient comp data
Active comps
vs active avg $/sqft $374
+$37 (+9.9%)
Active Properties (5)
Active Comparables
| Address | City | Year | BD | BTH | SqFt | LotSz | LP/SqFt | LP | DIM | Score |
|---|---|---|---|---|---|---|---|---|---|---|
| 3731 Avenue K14 | Lancaster | 1970 | 3 | 1 | 936 | 6,659 | $417 | $389,870 | 96 | 93 |
| 43001 38th | Lancaster | 1970 | 4 | 2 | 1,178 | 7,080 | $344 | $405,000 | 110 | 85 |
| 42946 39th Street | Lancaster | 1984 | 2 | 2 | 1,271 | 6,727 | $295 | $375,000 | 65 | 81 |
| 3506 Balmont | Lancaster | 1971 | 3 | 1 | 936 | 6,875 | $447 | $418,000 | 1180 | 79 |
| 43012 36th St W | Lancaster | 1971 | 5 | 2 | 1,157 | 6,587 | $367 | $425,000 | 95 | 77 |
| Total: 5 · Average | 3.4 | 1.6 | 1,095.6 | 6,785.6 | $374 | $402,574 | 309.2 | |||
| Median | 1,157 | $405,000 | ||||||||
Closed Properties (5)
Closed Comparables
| Address | City | Year | Date | BD | BTH | SqFt | LotSz | LP | SP | SP/SqFt | SP/LP | DIM | Score |
|---|---|---|---|---|---|---|---|---|---|---|---|---|---|
| 42804 Yew Street | Lancaster | 1971 | 09/18/2026 | 3 | 1 | 936 | 6,913 | $399,000 | $405,000 | $433 | 1.01 | 91 | 90 |
| 3518 Balmont | Lancaster | 1971 | 07/09/2026 | 3 | 1 | 936 | 6,529 | $369,999 | $384,000 | $410 | 1.04 | 43 | 89 |
| 42809 Alexo Drive | Lancaster | 1971 | 11/02/2026 | 4 | 2 | 1,178 | 7,118 | $440,000 | $440,000 | $374 | 1.00 | 103 | 85 |
| 42921 Alep | Lancaster | 1972 | 07/24/2026 | 3 | 2 | 1,200 | 6,674 | $399,900 | $410,000 | $342 | 1.02 | 45 | 81 |
| 42954 Lemonwood Drive | Lancaster | 1986 | 12/30/2025 | 3 | 2 | 1,244 | 6,600 | $419,000 | $419,000 | $337 | 1.00 | 30 | 71 |
| Total: 5 · Average | 3.2 | 1.6 | 1,098.8 | 6,766.8 | $411,600 | $411,600 | $379.2 | — | 62.4 | ||||
| Median | 1,178 | $410,000 | $410,000 | ||||||||||
Market Analysis
List vs Sale $/SqFt
Sale Price Trend
Days on Market
Sale vs List Price
AI-generated CMA
This analysis was generated automatically from MLS data. For an in-depth, human-reviewed valuation, contact Joseph Sardella at josephsardella@gmail.com.