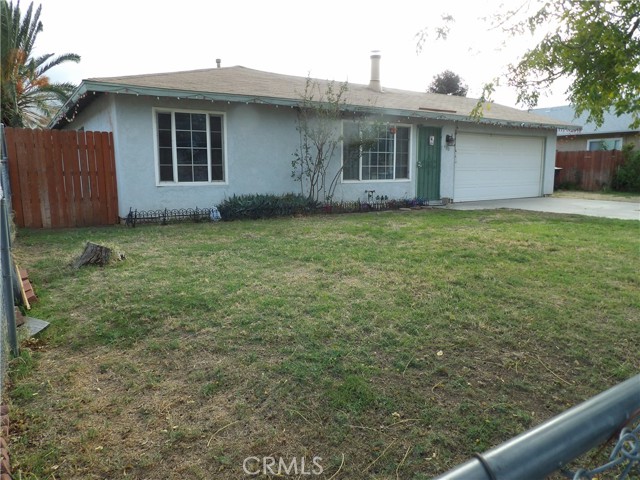
1 / 13
430 West Barbour, Banning, CA 92220
$450K4bd · 2ba · 1,204 sqft
Lot 6,970 sqft•Single Family Residence•Active•25d on market•MLS# IG-26228805
430 West Barbour, Banning, CA 92220
MLS# IG-26228805•Residential•Single Family Residence
Active25 days on market
$450,000
4
Beds
2
Baths
1,204
Sq Ft
6,970
Lot Sq Ft
1980
Year Built
Mountain(s), Peek-A-Boo
View
Property Description
*Fully Fenced Corner Lot *4 Bedrooms with Brand New Carpeting *2 Full Bathrooms *Fireplace *Tile Flooring in Main Areas *Kitchen Has Some Decorative Glass Cabinet Doors *Slider in Kitchen Leads to Covered Back Patio *Large Front and Back Yards *Central Heat and Air *Brand New Water Heater *2 Car Attached Garage
Features & Amenities
Not ApplicableFeeBuilt 1980
Property Details
Subdivision
Not Applicable
Land Type
Fee
Year Built
1980
Property Type
Residential
Property Subtype
Single Family Residence
Parking Spaces
2
Garage Spaces
2
Heating
Central
Cooling
Central Air
View
Mountain(s), Peek-A-Boo
Flooring
Carpet, Tile
Roof
Shingle
City
Banning
Zip Code
92220
County
Riverside
Mortgage Calculator
Current Rates
$
$
%
Monthly Payment
$2,275.44
Principal & Interest
Loan Amount
$360,000
Total Interest
$459,160
Total Payment Over 30 Years
$819,160
This calculator provides estimates only. Actual mortgage payments may include taxes, insurance, HOA fees, and PMI. Contact a lender for accurate quotes.
Comparative Market Analysis
Affordable Tier · 5 active · 5 closed
430 West Barbour, Banning, CA 92220
Not Applicable · Banning · Single Family Residence
$450K
Affordable TierBeds
4
Baths
2
Sqft
1,204
Lot
6,970 sqft
Year
1980
$/Sqft
$374
Pool: No✓
View: mountain✓
Garage: 2-car✓
Listed 3.2% below the median closed sale of $465,000. Closed comps sold at 101% of list — strong seller's market.
Price Position
Aligned with the market — fair pricing for the comps.
At market
Subject listed at $450K· $374/sqft
Total list price
Closed comps
vs closed median $465K
−$15K (−3.2%)
Active comps
vs active median $460K
−$10K (−2.2%)
Price per sqft
Closed compsinsufficient comp data
Active comps
vs active avg $/sqft $347
+$27 (+7.7%)
Active Properties (5)
Active Comparables
| Address | City | Year | BD | BTH | SqFt | LotSz | LP/SqFt | LP | DIM | Score |
|---|---|---|---|---|---|---|---|---|---|---|
| 678 Barbour | Banning | 1980 | 3 | 2 | 1,044 | 6,098 | $402 | $420,000 | 5 | 92 |
| 1425 Hays | Banning | 1953 | 3 | 2 | 1,204 | 11,761 | $399 | $480,000 | 83 | 80 |
| 647 Ramsey | Banning | 1910 | 4 | 2 | 1,440 | 6,098 | $309 | $445,000 | 129 | 77 |
| 906 4th | Banning | 1960 | 3 | 2 | 1,620 | 7,405 | $309 | $500,000 | 56 | 73 |
| 339 Wilson | Banning | 1935 | 3 | 2 | 1,445 | 9,148 | $318 | $459,900 | 28 | 71 |
| Total: 5 · Average | 3.2 | 2.0 | 1,350.6 | 8,102 | $347.4 | $460,980 | 60.2 | |||
| Median | 1,440 | $459,900 | ||||||||
Closed Properties (5)
Closed Comparables
| Address | City | Year | Date | BD | BTH | SqFt | LotSz | LP | SP | SP/SqFt | SP/LP | DIM | Score |
|---|---|---|---|---|---|---|---|---|---|---|---|---|---|
| 663 Ramsey | Banning | 1947 | 10/23/2026 | 4 | 2 | 1,163 | 6,098 | $440,000 | $465,000 | $400 | 1.06 | 74 | 82 |
| 57 3rd Street | Banning | 1964 | 07/27/2026 | 3 | 2 | 1,054 | 4,792 | $398,900 | $400,000 | $380 | 1.00 | 68 | 81 |
| 1447 Westward Avenue | Banning | 1978 | 12/18/2025 | 3 | 2 | 1,320 | 21,780 | $509,000 | $510,000 | $386 | 1.00 | 211 | 78 |
| 693 Wilson | Banning | 1955 | 06/22/2026 | 3 | 2 | 1,274 | 10,890 | $484,900 | $484,900 | $381 | 1.00 | 87 | 78 |
| 292 George Street | Banning | 1922 | 08/25/2026 | 3 | 1 | 1,170 | 11,326 | $395,000 | $395,000 | $338 | 1.00 | 54 | 75 |
| Total: 5 · Average | 3.2 | 1.8 | 1,196.2 | 10,977.2 | $450,980 | $450,980 | $377 | — | 98.8 | ||||
| Median | 1,170 | $465,000 | $465,000 | ||||||||||
Market Analysis
List vs Sale $/SqFt
Sale Price Trend
Days on Market
Sale vs List Price
AI-generated CMA
This analysis was generated automatically from MLS data. For an in-depth, human-reviewed valuation, contact Joseph Sardella at josephsardella@gmail.com.