409 Utica Avenue, D39, Huntington Beach, CA 92648
409 Utica Avenue, D39, Huntington Beach, CA 92648
Property Description
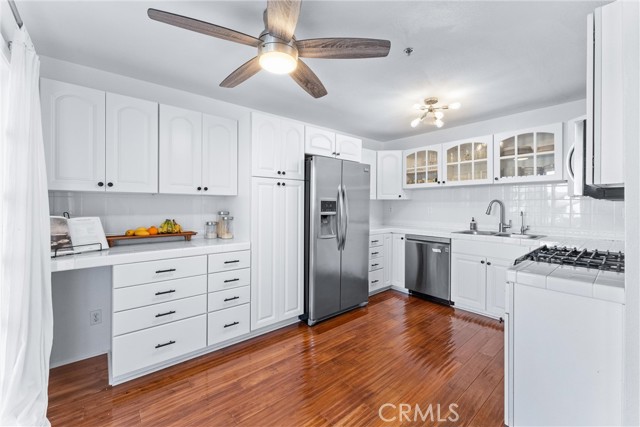
Three bedrooms, two bathrooms, and a Huntington Beach address that brings the coastal lifestyle home. Welcome to 409 Utica Avenue, D39, offering approximately 1,172 square feet with inviting finishes and room to make it your own. The bright kitchen features white cabinetry, glass-front display cabinets, stainless steel appliances, a gas cooktop, and ample storage, complemented by the warmth of wood flooring. Two bathrooms include generous vanity space, with a glass-enclosed walk-in shower and pebble-style shower floor adding a stylish touch to one. With three bedrooms, there’s flexibility for a home office, guest room, or space to unwind. Beyond your door, a palm-lined community pool and spa offer an easy escape beneath the Southern California sun. Add convenient access to downtown Huntington Beach, Main Street dining, the iconic pier, and the sand, and you have a home that makes the most of its coastal setting.
Features & Amenities
Property Details
Mortgage Calculator
Current Rates
Comparative Market Analysis
Affordable Tier · 5 active · 5 closed
Huntington Beach · Condominium
Listed 10.1% below the median closed sale of $700,000. Price per sqft ($537) is a 20% discount to closed comps ($673).
Price Position
Priced below the market — value advantage over the field.
Active Properties (5)
Active Comparables
| Address | City | Year | BD | BTH | SqFt | LotSz | LP/SqFt | LP | DIM | Score |
|---|---|---|---|---|---|---|---|---|---|---|
| 7402 Yellowtail Drive | Huntington Beach | 1984 | 2 | 2 | 1,079 | 103,376 | $648 | $699,000 | 113 | 85 |
| 20301 Bluffside Circle | Huntington Beach | 1988 | 2 | 2 | 1,101 | 176,372 | $635 | $699,000 | 114 | 85 |
| 306 Coral Reef | Huntington Beach | 1980 | 2 | 2 | 1,250 | 12,843 | $576 | $719,950 | 98 | 83 |
| 20122 Bayfront Lane | Huntington Beach | 1983 | 1 | 1 | 924 | 0 | $676 | $625,000 | 2 | 78 |
| 20371 Bluffside Circle | Huntington Beach | 1988 | 1 | 2 | 767 | 176,372 | $763 | $585,000 | 18 | 76 |
| Total: 5 · Average | 1.6 | 1.8 | 1,024.2 | 117,240.75 | $659.6 | $665,590 | 69 | |||
| Median | 1,079 | $699,000 | ||||||||
Closed Properties (5)
Closed Comparables
| Address | City | Year | Date | BD | BTH | SqFt | LotSz | LP | SP | SP/SqFt | SP/LP | DIM | Score |
|---|---|---|---|---|---|---|---|---|---|---|---|---|---|
| 409 Utica | Huntington Beach | 1993 | 09/18/2026 | 3 | 2 | 1,166 | 75,973 | $649,900 | $637,000 | $546 | 0.98 | 164 | 99 |
| 19342 Sunray Lane | Huntington Beach | 1987 | 07/06/2026 | 2 | 2 | 1,084 | 0 | $725,000 | $715,000 | $660 | 0.99 | 16 | 87 |
| 19442 Sunray Ln | Huntington Beach | 1987 | 05/29/2026 | 2 | 2 | 873 | 0 | $699,000 | $680,000 | $779 | 0.97 | 37 | 83 |
| 19311 Sunray Lane | Huntington Beach | 1984 | 05/01/2026 | 2 | 2 | 1,084 | 120,960 | $699,900 | $700,000 | $646 | 1.00 | 40 | 80 |
| 2323 Huntington Street | Huntington Beach | 1978 | 01/12/2026 | 2 | 2 | 973 | 181,890 | $699,995 | $715,000 | $735 | 1.02 | 35 | 78 |
| Total: 5 · Average | 2.2 | 2.0 | 1,036 | 126,274.333 | $689,400 | $689,400 | $673.2 | — | 58.4 | ||||
| Median | 1,084 | $700,000 | $700,000 | ||||||||||
Market Analysis
List vs Sale $/SqFt
Sale Price Trend
Days on Market
Sale vs List Price
This analysis was generated automatically from MLS data. For an in-depth, human-reviewed valuation, contact Joseph Sardella at josephsardella@gmail.com.