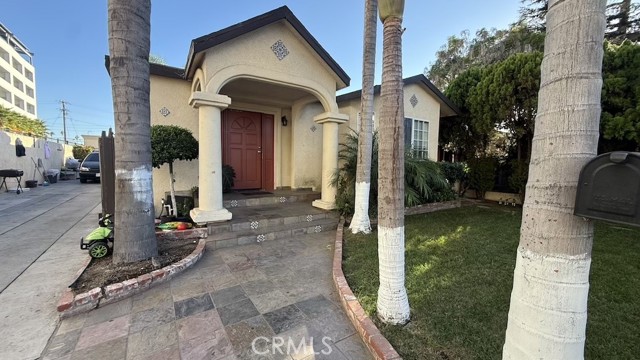
4052 West 101st, Inglewood, CA 90304
4052 West 101st, Inglewood, CA 90304
Property Description
**Charming Single-Family Home in a Prime Inglewood Location!** This great oppportunity will not last in the heart of Inglewood! This 3-bedroom, 2-bathroom single-family home offers a wonderful opportunity for homeowners and investors alike. The property features a converted garage offering additional flexible space, perfect for a home office, hobby room, or other potential uses. A long driveway provides ample off-street parking. Conveniently located within walking distance of local shops, restaurants, and everyday amenities, this home is also just minutes from the world-famous SoFi Stadium, Hollywood Park, and major entertainment destinations. Enjoy easy access to nearby freeways and all that the vibrant city of Inglewood has to offer. Whether you're looking for a place to call home or an investment opportunity, this property offers great potential in a highly desirable and growing area. **Don't miss this opportunity to own in Inglewood!**
Features & Amenities
Property Details
Mortgage Calculator
Current Rates
Comparative Market Analysis
Affordable Tier · 5 active · 5 closed
Inglewood · Single Family Residence
Listed 14.7% above the median closed sale of $870,000. Price per sqft ($878) is a 22% premium to closed comps ($718).
Price Position
Positioned above the market — commands a premium.
Active Properties (5)
Active Comparables
| Address | City | Year | BD | BTH | SqFt | LotSz | LP/SqFt | LP | DIM | Score |
|---|---|---|---|---|---|---|---|---|---|---|
| 9601 8th | Inglewood | 1942 | 4 | 1 | 1,203 | 6,587 | $748 | $900,000 | 3 | 80 |
| 3502 111th | Inglewood | 1926 | 2 | 1 | 1,196 | 6,000 | $736 | $880,000 | 18 | 78 |
| 10517 Cimarron | Los Angeles | 1947 | 3 | 2 | 1,400 | 5,455 | $621 | $869,900 | 55 | 76 |
| 9133 7th Avenue | Inglewood | 1939 | 3 | 2 | 1,430 | 8,507 | $629 | $900,000 | 28 | 76 |
| 11804 Wilkie | Hawthorne | 1954 | 3 | 2 | 1,401 | 5,102 | $607 | $849,900 | 93 | 72 |
| Total: 5 · Average | 3.0 | 1.6 | 1,326 | 6,330.2 | $668.2 | $879,960 | 39.4 | |||
| Median | 1,400 | $880,000 | ||||||||
Closed Properties (5)
Closed Comparables
| Address | City | Year | Date | BD | BTH | SqFt | LotSz | LP | SP | SP/SqFt | SP/LP | DIM | Score |
|---|---|---|---|---|---|---|---|---|---|---|---|---|---|
| 252 Hardy | Inglewood | 1926 | 05/21/2026 | 3 | 2 | 1,444 | 5,338 | $950,000 | $960,000 | $665 | 1.01 | 59 | 78 |
| 1121 Eucalyptus | Inglewood | 1924 | 08/05/2026 | 4 | 3 | 1,200 | 5,816 | $975,000 | $975,000 | $812 | 1.00 | 53 | 75 |
| 3907 109th Street | Inglewood | 1923 | 07/27/2026 | 3 | 1 | 766 | 9,030 | $850,000 | $850,000 | $1,110 | 1.00 | 146 | 75 |
| 9619 11th Avenue | Inglewood | 1952 | 07/01/2026 | 3 | 2 | 1,606 | 7,162 | $849,999 | $865,000 | $539 | 1.02 | 50 | 72 |
| 3937 106th Street | Inglewood | 1951 | 04/23/2026 | 4 | 2 | 1,870 | 10,411 | $899,900 | $870,000 | $465 | 0.97 | 62 | 66 |
| Total: 5 · Average | 3.4 | 2.0 | 1,377.2 | 7,551.4 | $904,000 | $904,000 | $718.2 | — | 74 | ||||
| Median | 1,444 | $870,000 | $870,000 | ||||||||||
Market Analysis
List vs Sale $/SqFt
Sale Price Trend
Days on Market
Sale vs List Price
This analysis was generated automatically from MLS data. For an in-depth, human-reviewed valuation, contact Joseph Sardella at josephsardella@gmail.com.