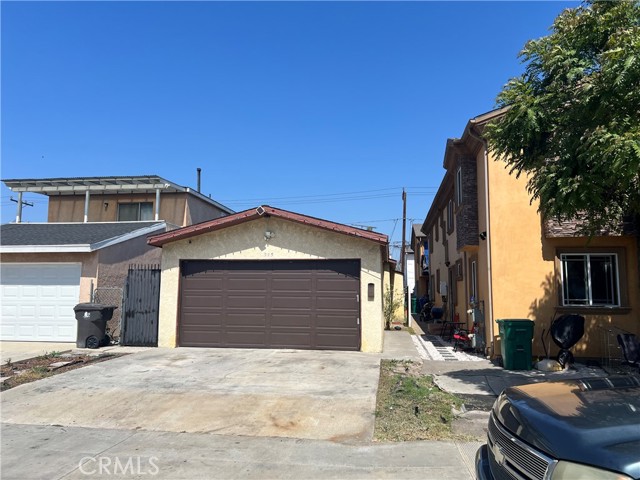
345 East 53rd, Long Beach, CA 90805
345 East 53rd, Long Beach, CA 90805
Property Description
This lovely 3 bedroom 1 bathroom home is available and ready for your buyers. Large lot, Possible ADU if you hava a creative mind. The owners are relocating to another state, and are really anxious to sell this wonderful home. Please submit your highest and best offers.
Features & Amenities
Property Details
Mortgage Calculator
Current Rates
About North Long Beach
This property is located in North Long Beach, a community in Long Beach. Explore more listings in this neighborhood to compare options and pricing.
View North Long Beach ListingsComparative Market Analysis
Affordable Tier · 1 active · 5 closed
North Long Beach · Long Beach · Single Family Residence
Listed 10.9% above the median closed sale of $550,000. Price per sqft ($897) is a 10% discount to closed comps ($1,001).
Price Position
Positioned above the market — commands a premium.
Active Properties (1)
Active Comparables
| Address | City | Year | BD | BTH | SqFt | LotSz | LP/SqFt | LP | DIM | Score |
|---|---|---|---|---|---|---|---|---|---|---|
| 1083 Rio Grande Street | Pasadena | 1923 | 1 | 1 | 528 | 2,100 | $1,134 | $599,000 | 9 | 66 |
| Total: 1 · Average | 1.0 | 1.0 | 528 | 2,100 | $1,134 | $599,000 | 9 | |||
| Median | 528 | $599,000 | ||||||||
Closed Properties (5)
Closed Comparables
| Address | City | Year | Date | BD | BTH | SqFt | LotSz | LP | SP | SP/SqFt | SP/LP | DIM | Score |
|---|---|---|---|---|---|---|---|---|---|---|---|---|---|
| 100 Palmetto Drive | Pasadena | 1915 | 06/05/2026 | 1 | 1 | 462 | 1,524 | $550,000 | $540,000 | $1,169 | 0.98 | 31 | 65 |
| 233 Ohio Street | Pasadena | 1913 | 05/12/2026 | 1 | 1 | 840 | 1,726 | $599,000 | $550,000 | $655 | 0.92 | 75 | 64 |
| 279 Palisade Street | Pasadena | 1953 | 06/23/2026 | 2 | 1 | 788 | 3,466 | $649,000 | $640,000 | $812 | 0.99 | 22 | 62 |
| 100 Palmetto Drive | Pasadena | 1915 | 12/30/2025 | 1 | 1 | 462 | 1,890 | $574,000 | $555,000 | $1,201 | 0.97 | 104 | 62 |
| 100 Palmetto Drive | Pasadena | 1915 | 12/29/2025 | 1 | 1 | 462 | 1,518 | $575,000 | $540,000 | $1,169 | 0.94 | 75 | 62 |
| Total: 5 · Average | 1.2 | 1.0 | 602.8 | 2,024.8 | $565,000 | $565,000 | $1,001.2 | — | 61.4 | ||||
| Median | 462 | $550,000 | $550,000 | ||||||||||
Market Analysis
List vs Sale $/SqFt
Sale Price Trend
Days on Market
Sale vs List Price
This analysis was generated automatically from MLS data. For an in-depth, human-reviewed valuation, contact Joseph Sardella at josephsardella@gmail.com.