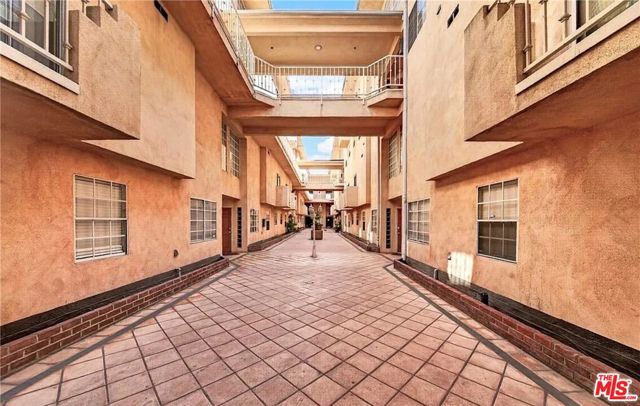
321 West Queen Street, 24, Inglewood, CA 90301
321 West Queen Street, 24, Inglewood, CA 90301
Property Description
RARE TOP-FLOOR, TWO-STORY CONDO IN THE HEART OF INGLEWOOD! This spacious 3-bedroom, 3-bathroom residence offers approximately 1,490 square feet of living space, soaring ceilings, abundant natural light, and one of the larger floor plans in the community.Step inside to a welcoming living room featuring recessed lighting, engineered hardwood floors, granite countertops, and a striking see-through gas fireplace that creates a warm connection between the living and dining areas. The adjacent dining area includes a convenient wet bar with granite counters perfect for entertaining. The well-appointed kitchen features a stove, microwave, dishwasher, and ample counter space, while washer and dryer hookups are conveniently located on the main level.Enjoy the convenience of dedicated tandem garage parking and the security of a gated community. With three bedrooms and three bathrooms, this home provides exceptional space and flexibility for homeowners, guests, or a home office.Location is everything! You'll be just minutes from SoFi Stadium, Intuit Dome, Kia Forum, LAX, major freeways, and Metro transit, placing you at the center of Inglewood's remarkable transformation and growth. The beaches, Downtown Los Angeles, and Hollywood are also easily accessible. A rare opportunity to own a generously sized 3-bedroom, 3-bathroom condo in one of Los Angeles County's most exciting and rapidly evolving areas without the million-dollar price tag. Come see why this one is special!
Features & Amenities
Property Details
Mortgage Calculator
Current Rates
Comparative Market Analysis
Affordable Tier · 5 active · 5 closed
Inglewood · Condominium
Listed in line with the median closed sale of $555,555. Price per sqft ($383) is a 21% discount to closed comps ($487). Closed comps sold at 108% of list — strong seller's market.
Price Position
Aligned with the market — fair pricing for the comps.
Active Properties (5)
Active Comparables
| Address | City | Year | BD | BTH | SqFt | LotSz | LP/SqFt | LP | DIM | Score |
|---|---|---|---|---|---|---|---|---|---|---|
| 321 W. Queen St. Unit 8 | Inglewood | 1992 | 3 | 3 | 1,317 | 19,260 | $417 | $549,000 | 17 | 93 |
| 321 Queen Street | Inglewood | 1992 | 3 | 3 | 1,322 | 19,877 | $435 | $575,000 | 107 | 92 |
| 550 Regent Street | Inglewood | 1972 | 3 | 4 | 1,349 | 84,428 | $452 | $610,000 | 205 | 76 |
| 6922 Knowlton Place | Los Angeles | 1997 | 2 | 2 | 1,160 | 20,707 | $517 | $599,900 | 38 | 76 |
| 313 Hyde Park | Inglewood | 1987 | 3 | 2 | 1,086 | 27,748 | $516 | $560,000 | 155 | 74 |
| Total: 5 · Average | 2.8 | 2.8 | 1,246.8 | 34,404 | $467.4 | $578,780 | 104.4 | |||
| Median | 1,317 | $575,000 | ||||||||
Closed Properties (5)
Closed Comparables
| Address | City | Year | Date | BD | BTH | SqFt | LotSz | LP | SP | SP/SqFt | SP/LP | DIM | Score |
|---|---|---|---|---|---|---|---|---|---|---|---|---|---|
| 321 Queen Street | Inglewood | 1992 | 08/07/2026 | 3 | 3 | 1,317 | 19,877 | $585,000 | $550,000 | $418 | 0.94 | 41 | 93 |
| 822 Victor Avenue | Inglewood | 1981 | 10/07/2026 | 2 | 3 | 1,086 | 22,424 | $559,000 | $562,000 | $517 | 1.00 | 65 | 79 |
| 800 Glenway Drive | Inglewood | 1990 | 06/30/2026 | 2 | 3 | 1,034 | 0 | $545,000 | $530,000 | $513 | 0.97 | 81 | 79 |
| 519 Hazel Street | Inglewood | 1988 | 12/31/2025 | 3 | 3 | 1,288 | 20,006 | $395,000 | $589,000 | $457 | 1.49 | 167 | 78 |
| 856 Beach Avenue | Inglewood | 1989 | 08/19/2026 | 2 | 3 | 1,051 | 25,104 | $549,000 | $555,555 | $529 | 1.01 | 42 | 78 |
| Total: 5 · Average | 2.4 | 3.0 | 1,155.2 | 21,852.75 | $557,311 | $557,311 | $486.8 | — | 79.2 | ||||
| Median | 1,086 | $555,555 | $555,555 | ||||||||||
Market Analysis
List vs Sale $/SqFt
Sale Price Trend
Days on Market
Sale vs List Price
This analysis was generated automatically from MLS data. For an in-depth, human-reviewed valuation, contact Joseph Sardella at josephsardella@gmail.com.