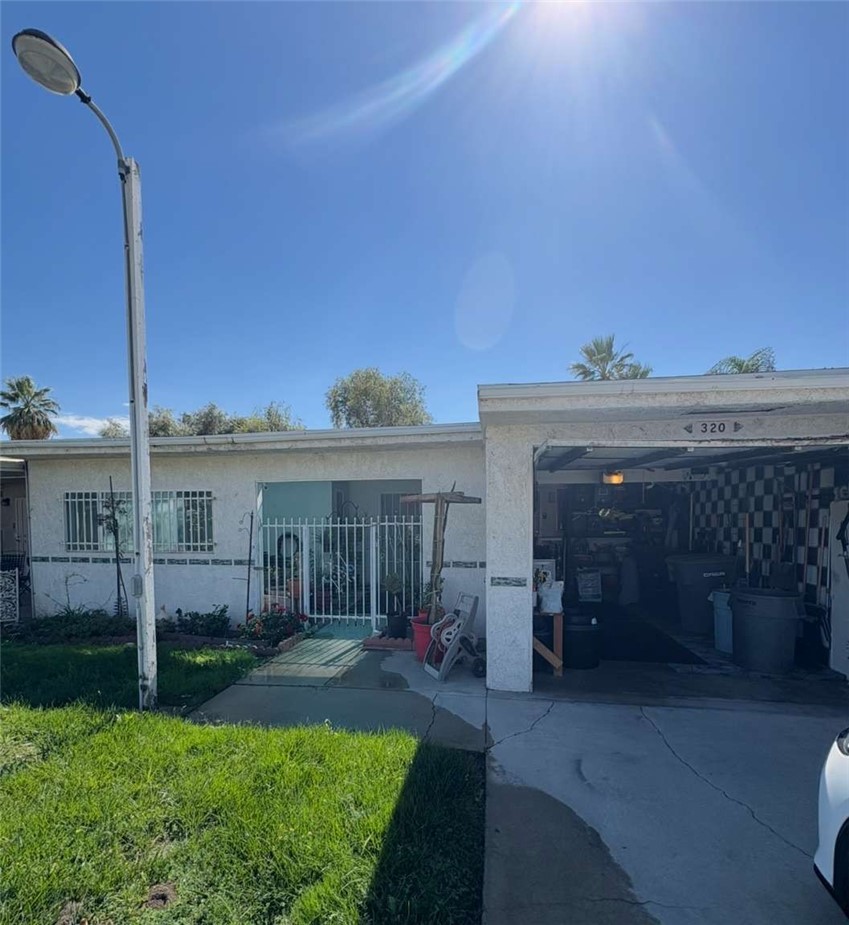
1 / 4
320 East 7th Street, San Jacinto, CA 92583
$230K2bd · 1ba · 988 sqft
Lot 3,049 sqft•HOA $120/mo•Single Family Residence•Active•14d on market•MLS# FR-26234230
320 East 7th Street, San Jacinto, CA 92583
MLS# FR-26234230•Residential•Single Family Residence
Active14 days on market
$230,000
2
Beds
1
Baths
988
Sq Ft
3,049
Lot Sq Ft
$120
HOA/mo
1961
Year Built
None
View
Property Description
This is in a 55+ year old community. Cozy and beautiful residence in San Jacinto CA. This is a great home, in move in ready shape; in a great neighborhood. Looking at all offers, make sure to submit yours.
Features & Amenities
FeeBuilt 1961
Property Details
Land Type
Fee
Year Built
1961
Property Type
Residential
Property Subtype
Single Family Residence
Parking Spaces
1
Garage Spaces
1
Heating
Central
Cooling
Central Air
View
None
City
San Jacinto
Zip Code
92583
County
Riverside
Mortgage Calculator
Current Rates
$
$
%
Monthly Payment
$1,163.01
Principal & Interest
Loan Amount
$184,000
Total Interest
$234,682
Total Payment Over 30 Years
$418,682
This calculator provides estimates only. Actual mortgage payments may include taxes, insurance, HOA fees, and PMI. Contact a lender for accurate quotes.
Comparative Market Analysis
Affordable Tier · 5 active · 5 closed
320 East 7th Street, San Jacinto, CA 92583
San Jacinto · Single Family Residence
$230K
Affordable TierBeds
2
Baths
1
Sqft
988
Lot
3,049 sqft
Year
1961
$/Sqft
$233
Pool: No✓
View: mountain✓
Garage: 1-car✓
Listed in line with the median closed sale of $230,000.
Price Position
Aligned with the market — fair pricing for the comps.
At market
Subject listed at $230K· $233/sqft
Total list price
Closed comps
vs closed median $230K
$0 (0.0%)
Active comps
vs active median $239K
−$9K (−3.8%)
Price per sqft
Closed compsinsufficient comp data
Active comps
vs active avg $/sqft $268
−$35 (−13.0%)
Active Properties (5)
Active Comparables
| Address | City | Year | BD | BTH | SqFt | LotSz | LP/SqFt | LP | DIM | Score |
|---|---|---|---|---|---|---|---|---|---|---|
| 1448 Bunker Hill | San Jacinto | 1984 | 2 | 1 | 860 | 2,597 | $278 | $239,000 | 34 | 84 |
| 1364 Sierra Seneca Drive | San Jacinto | 1981 | 2 | 2 | 1,040 | 1,658 | $230 | $239,000 | 93 | 71 |
| 648 San Rogelio | Hemet | 1976 | 2 | 1 | 827 | 3,920 | $266 | $220,000 | 22 | 68 |
| 641 Solano Drive | Hemet | 1981 | 2 | 2 | 875 | 3,920 | $297 | $260,000 | 51 | 67 |
| 1961 Nuevo Street | Hemet | 1981 | 2 | 1 | 820 | 3,920 | $268 | $220,000 | 37 | 67 |
| Total: 5 · Average | 2.0 | 1.4 | 884.4 | 3,203 | $267.8 | $235,600 | 47.4 | |||
| Median | 860 | $239,000 | ||||||||
Closed Properties (5)
Closed Comparables
| Address | City | Year | Date | BD | BTH | SqFt | LotSz | LP | SP | SP/SqFt | SP/LP | DIM | Score |
|---|---|---|---|---|---|---|---|---|---|---|---|---|---|
| 1331 Freedom | San Jacinto | 1985 | 10/23/2026 | 2 | 2 | 1,015 | 3,720 | $250,100 | $250,100 | $246 | 1.00 | 35 | 83 |
| 638 Estudillo | San Jacinto | 1950 | 02/13/2026 | 2 | 1 | 996 | 9,148 | $215,000 | $215,000 | $216 | 1.00 | 0 | 80 |
| 1443 Bunker Hill | San Jacinto | 1985 | 01/21/2026 | 2 | 2 | 1,065 | 3,484 | $229,900 | $222,000 | $208 | 0.97 | 70 | 79 |
| 1461 Congress Way | San Jacinto | 1991 | 02/09/2026 | 2 | 2 | 1,033 | 3,080 | $229,900 | $230,000 | $223 | 1.00 | 66 | 79 |
| 1354 Yorktown Circle | San Jacinto | 1986 | 12/05/2025 | 2 | 2 | 1,106 | 2,802 | $254,000 | $257,000 | $232 | 1.01 | 92 | 77 |
| Total: 5 · Average | 2.0 | 1.8 | 1,043 | 4,446.8 | $234,820 | $234,820 | $225 | — | 52.6 | ||||
| Median | 1,033 | $230,000 | $230,000 | ||||||||||
Market Analysis
List vs Sale $/SqFt
Sale Price Trend
Days on Market
Sale vs List Price
AI-generated CMA
This analysis was generated automatically from MLS data. For an in-depth, human-reviewed valuation, contact Joseph Sardella at josephsardella@gmail.com.