1 / 21
2411 Exposition Place, Los Angeles, CA 90018
$1.30M0bd · 1ba · 2,400 sqft
Lot 4,528 sqft•Single Family Residence•Active•91d on market•MLS# 00-26874255
2411 Exposition Place, Los Angeles, CA 90018
MLS# 00-26874255•Residential•Single Family Residence
Active91 days on market
$1,299,000
0
Beds
1
Baths
2,400
Sq Ft
4,528
Lot Sq Ft
1947
Year Built
Property Description
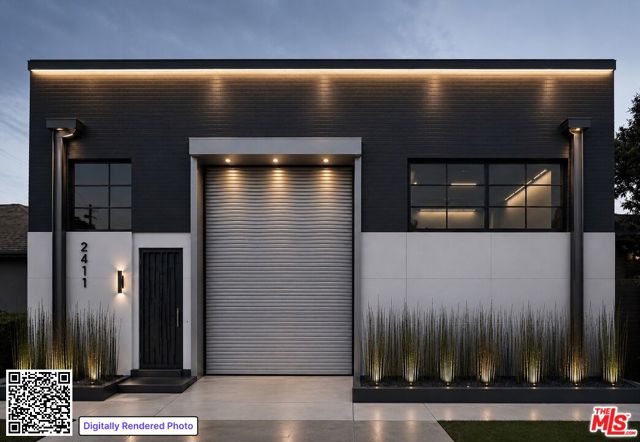
BOM! Legal non-conforming brick warehouse in a residential neighborhood. Down zoned from Commercial to LARD1.5 with light manufacturing use. Centrally located to USC, Leimert Park and West Adams.
Features & Amenities
FeeBuilt 1947
Property Details
Land Type
Fee
Year Built
1947
Property Type
Residential
Property Subtype
Single Family Residence
City
Los Angeles
Zip Code
90018
County
Los Angeles
Mortgage Calculator
Current Rates
$
$
%
Monthly Payment
$6,568.45
Principal & Interest
Loan Amount
$1,039,200
Total Interest
$1,325,442
Total Payment Over 30 Years
$2,364,642
This calculator provides estimates only. Actual mortgage payments may include taxes, insurance, HOA fees, and PMI. Contact a lender for accurate quotes.
Comparative Market Analysis
Residential Tier · 5 active · 5 closed
2411 Exposition Place, Los Angeles, CA 90018
Los Angeles · Single Family Residence
$1.30M
Residential TierBeds
0
Baths
1
Sqft
2,400
Lot
4,528 sqft
Year
1947
$/Sqft
$541
Pool: No✓
Spa: No✓
Listed in line with the median closed sale of $1,330,000. Price per sqft ($541) is a 23% discount to closed comps ($705). Closed comps sold at 105% of list — strong seller's market.
Price Position
Aligned with the market — fair pricing for the comps.
At market
Subject listed at $1.30M· $541/sqft
Total list price
Closed comps
vs closed median $1.33M
−$31K (−2.3%)
Active comps
vs active median $1.33M
−$30K (−2.3%)
Price per sqft
Closed compsinsufficient comp data
Active comps
vs active avg $/sqft $702
−$161 (−22.9%)
Active Properties (5)
Active Comparables
| Address | City | Year | BD | BTH | SqFt | LotSz | LP/SqFt | LP | DIM | Score |
|---|---|---|---|---|---|---|---|---|---|---|
| 3880 Olmsted Avenue | Los Angeles | 1940 | 3 | 2 | 1,776 | 6,005 | $748 | $1.33M | 38 | 79 |
| 3810 Olmsted Avenue | Los Angeles | 1940 | 3 | 2 | 1,692 | 6,125 | $750 | $1.27M | 87 | 78 |
| 2800 Obama | Los Angeles | 1976 | 4 | 2 | 2,956 | 8,003 | $474 | $1.40M | 16 | 75 |
| 1829 Middleton Place | Los Angeles | 1912 | 4 | 3 | 1,940 | 5,161 | $593 | $1.15M | 16 | 74 |
| 3868 3rd Avenue | Los Angeles | 1924 | 3 | 3 | 1,468 | 5,289 | $943 | $1.38M | 15 | 69 |
| Total: 5 · Average | 3.4 | 2.4 | 1,966.4 | 6,116.6 | $701.6 | $1.31M | 34.4 | |||
| Median | 1,776 | $1.33M | ||||||||
Closed Properties (5)
Closed Comparables
| Address | City | Year | Date | BD | BTH | SqFt | LotSz | LP | SP | SP/SqFt | SP/LP | DIM | Score |
|---|---|---|---|---|---|---|---|---|---|---|---|---|---|
| 3905 Roxton Avenue | Los Angeles | 1937 | 06/18/2026 | 3 | 2 | 1,762 | 5,402 | $1.33M | $1.33M | $755 | 1.00 | 70 | 80 |
| 3786 Dublin | Los Angeles | 1938 | 09/30/2026 | 5 | 3 | 2,120 | 6,065 | $1.09M | $1.14M | $535 | 1.04 | 237 | 78 |
| 3860 Hepburn Avenue | Los Angeles | 1939 | 12/05/2025 | 4 | 2 | 1,850 | 6,001 | $1.10M | $1.35M | $730 | 1.23 | 51 | 72 |
| 3722 Degnan Boulevard | Los Angeles | 1940 | 08/07/2026 | 3 | 2 | 1,445 | 5,979 | $1.18M | $1.15M | $799 | 0.98 | 67 | 70 |
| 3927 Welland Avenue | Leimert Park | 1937 | 12/08/2025 | 3 | 3 | 1,911 | 6,102 | $1.36M | $1.35M | $706 | 0.99 | 81 | 70 |
| Total: 5 · Average | 3.6 | 2.4 | 1,817.6 | 5,909.8 | $1.26M | $1.26M | $705 | — | 101.2 | ||||
| Median | 1,850 | $1.33M | $1.33M | ||||||||||
Market Analysis
List vs Sale $/SqFt
Sale Price Trend
Days on Market
Sale vs List Price
AI-generated CMA
This analysis was generated automatically from MLS data. For an in-depth, human-reviewed valuation, contact Joseph Sardella at josephsardella@gmail.com.