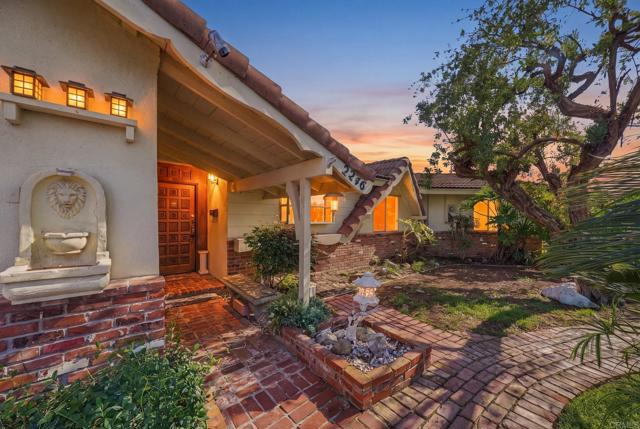
2246 Edgewood Place, Oceanside, CA 92054
2246 Edgewood Place, Oceanside, CA 92054
Property Description
Welcome to 2246 Edgewood Place, an exciting opportunity in the heart of Oceanside just a hop, skip and a jump to the Ocean! Situated in an established neighborhood, this property offers endless possibilities to bring your vision to life. With the opportunity to personalize, update, and create a space that reflects your own style, this home is full of potential. Whether you're looking to refresh the existing space or explore new design possibilities, this property provides a great starting point. Conveniently located near shopping, dining, parks, schools, major transportation routes, and Oceanside's beautiful beaches. Don't miss the chance to unlock the possibilities and make this property your own!
Features & Amenities
Property Details
Mortgage Calculator
Current Rates
Comparative Market Analysis
Residential Tier · 5 active · 5 closed
Oceanside · Single Family Residence
Listed in line with the median closed sale of $993,000. Price per sqft ($447) is a 37% discount to closed comps ($706). Closed comps sold at 104% of list — strong seller's market.
Price Position
Aligned with the market — fair pricing for the comps.
Active Properties (5)
Active Comparables
| Address | City | Year | BD | BTH | SqFt | LotSz | LP/SqFt | LP | DIM | Score |
|---|---|---|---|---|---|---|---|---|---|---|
| 2432 Sarbonne Drive | Oceanside | 1961 | 4 | 3 | 1,569 | 7,405 | $558 | $875,000 | 6 | 69 |
| 341 Brooks Street | Oceanside | 1948 | 4 | 3 | 1,809 | 4,913 | $525 | $949,900 | 17 | 67 |
| 1420 San Simeon Street | Oceanside | 1954 | 4 | 3 | 1,190 | 6,600 | $890 | $1.06M | 73 | 62 |
| 3428 Spindrift Court | Oceanside | 1988 | 3 | 2 | 1,476 | 7,967 | $609 | $899,000 | 9 | 62 |
| 2250 Oceanside | Oceanside | 1965 | 3 | 2 | 1,188 | 15,500 | $715 | $849,000 | 19 | 62 |
| Total: 5 · Average | 3.6 | 2.6 | 1,446.4 | 8,477 | $659.4 | $926,380 | 24.8 | |||
| Median | 1,476 | $899,000 | ||||||||
Closed Properties (5)
Closed Comparables
| Address | City | Year | Date | BD | BTH | SqFt | LotSz | LP | SP | SP/SqFt | SP/LP | DIM | Score |
|---|---|---|---|---|---|---|---|---|---|---|---|---|---|
| 169 Cregar Street | Oceanside | 1960 | 10/16/2026 | 3 | 2 | 1,176 | 6,098 | $1.05M | $1.06M | $901 | 1.01 | 65 | 87 |
| 2142 Foster | Oceanside | 1960 | 10/15/2026 | 5 | 2 | 2,114 | 9,100 | $975,000 | $950,000 | $449 | 0.97 | 27 | 78 |
| 147 Edgewood Drive | Oceanside | 1959 | 11/05/2026 | 3 | 2 | 1,264 | 6,534 | $825,000 | $898,000 | $710 | 1.09 | 20 | 78 |
| 2904 Barnwell Street | Oceanside | 1961 | 07/10/2026 | 3 | 2 | 1,508 | 7,841 | $1.05M | $1.05M | $696 | 1.00 | 37 | 77 |
| 2222 Crestline Dr. | Oceanside | 1960 | 06/18/2026 | 3 | 2 | 1,280 | 6,800 | $875,000 | $993,000 | $776 | 1.14 | 23 | 76 |
| Total: 5 · Average | 3.4 | 2.0 | 1,468.4 | 7,274.6 | $990,200 | $990,200 | $706.4 | — | 34.4 | ||||
| Median | 1,280 | $993,000 | $993,000 | ||||||||||
Market Analysis
List vs Sale $/SqFt
Sale Price Trend
Days on Market
Sale vs List Price
This analysis was generated automatically from MLS data. For an in-depth, human-reviewed valuation, contact Joseph Sardella at josephsardella@gmail.com.