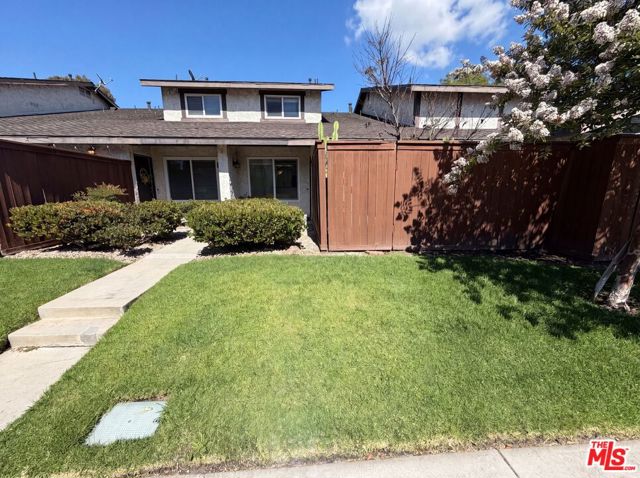
22432 South Vermont Avenue, 2, Torrance, CA 90502
22432 South Vermont Avenue, 2, Torrance, CA 90502
Property Description
Imagine 22432 S Vermont Ave, a residence arranged for everyday practicality and ease, designed with functional living in mind. The primary bedroom includes a walk in closet, providing substantial storage and maintaining an organized interior. Outside, the property features a fully fenced in backyard, enhancing usability for various outdoor activities and adding to the functional exterior.. Included 100-Day Home Warranty with buyer activation
Features & Amenities
Property Details
Mortgage Calculator
Current Rates
Comparative Market Analysis
Affordable Tier · 5 active · 5 closed
Torrance · Townhouse
Listed 7.9% below the median closed sale of $635,000.
Price Position
Priced below the market — value advantage over the field.
Active Properties (5)
Active Comparables
| Address | City | Year | BD | BTH | SqFt | LotSz | LP/SqFt | LP | DIM | Score |
|---|---|---|---|---|---|---|---|---|---|---|
| 23314 Vermont | Torrance | 1974 | 2 | 1 | 872 | 182,528 | $631 | $549,999 | 36 | 77 |
| 1608 226th | Torrance | 2006 | 3 | 3 | 1,130 | 7,205 | $530 | $599,000 | 132 | 72 |
| 535 223rd Street | Carson | 1985 | 3 | 3 | 1,560 | 36,545 | $420 | $655,000 | 95 | 67 |
| 26131 Frampton Ave | Harbor City | 1987 | 2 | 2 | 1,031 | 66,553 | $572 | $590,000 | 15 | 64 |
| 25220 Belle Porte Avenue | Harbor City | 1978 | 3 | 3 | 1,616 | 8,673 | $408 | $659,000 | 33 | 61 |
| Total: 5 · Average | 2.6 | 2.4 | 1,241.8 | 60,300.8 | $512.2 | $610,599.8 | 62.2 | |||
| Median | 1,130 | $599,000 | ||||||||
Closed Properties (5)
Closed Comparables
| Address | City | Year | Date | BD | BTH | SqFt | LotSz | LP | SP | SP/SqFt | SP/LP | DIM | Score |
|---|---|---|---|---|---|---|---|---|---|---|---|---|---|
| 22232 Vermont | Torrance | 1985 | 08/07/2026 | 3 | 2 | 1,219 | 181,676 | $499,900 | $510,000 | $418 | 1.02 | 50 | 92 |
| 22346 Harbor Ridge Lane | Torrance | 1980 | 06/09/2026 | 3 | 2 | 1,287 | 167,371 | $625,000 | $630,000 | $490 | 1.01 | 73 | 88 |
| 722 223rd | Torrance | 1979 | 06/05/2026 | 3 | 2 | 1,287 | 211,105 | $649,000 | $649,000 | $504 | 1.00 | 80 | 85 |
| 22932 Vermont Avenue | Torrance | 1973 | 10/23/2026 | 3 | 2 | 1,113 | 9,510 | $645,000 | $635,000 | $571 | 0.98 | 97 | 85 |
| 1126 228th Street | Torrance | 1990 | 08/31/2026 | 3 | 3 | 1,210 | 18,523 | $669,000 | $659,000 | $545 | 0.98 | 131 | 80 |
| Total: 5 · Average | 3.0 | 2.2 | 1,223.2 | 117,637 | $616,600 | $616,600 | $505.6 | — | 86.2 | ||||
| Median | 1,219 | $635,000 | $635,000 | ||||||||||
Market Analysis
List vs Sale $/SqFt
Sale Price Trend
Days on Market
Sale vs List Price
This analysis was generated automatically from MLS data. For an in-depth, human-reviewed valuation, contact Joseph Sardella at josephsardella@gmail.com.