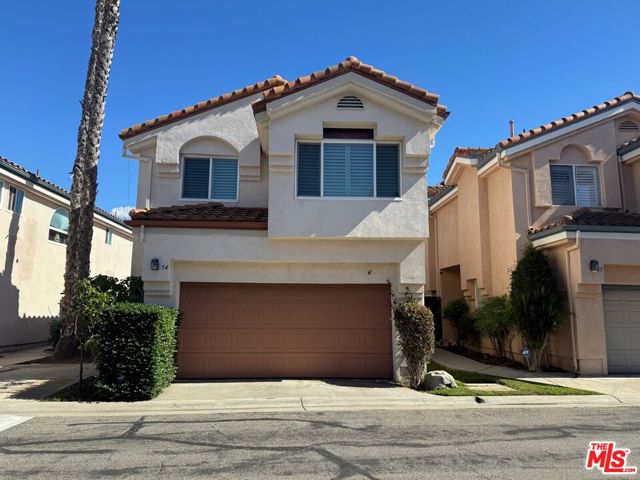
22330 Meyler Street, 54, Torrance, CA 90502
22330 Meyler Street, 54, Torrance, CA 90502
Property Description
Rare opportunity in the gated Torrance Gateway Estates. This detached home was remodeled four years ago and features hardwood floors throughout and a roof replaced just one year ago the big-ticket items are already done. Enjoy a private enclosed backyard, a 2-car garage, and community amenities including a pool and spa, all minutes from freeways, shopping, and dining. HOA $350/mo. Homes in this community rarely come available don't miss it.
Features & Amenities
Property Details
Mortgage Calculator
Current Rates
Comparative Market Analysis
Residential Tier · 5 active · 5 closed
Torrance · Single Family Residence
Listed 3.3% above the median closed sale of $869,900. Price per sqft ($391) is a 24% discount to closed comps ($517). Closed comps sold at 101% of list — strong seller's market.
Price Position
Aligned with the market — fair pricing for the comps.
Active Properties (5)
Active Comparables
| Address | City | Year | BD | BTH | SqFt | LotSz | LP/SqFt | LP | DIM | Score |
|---|---|---|---|---|---|---|---|---|---|---|
| 22330 Meyler Street | Torrance | 1990 | 4 | 3 | 2,302 | 248,831 | $399 | $918,000 | 60 | 94 |
| 22330 Meyler Street | Torrance | 1990 | 4 | 3 | 2,258 | 248,774 | $410 | $925,000 | 106 | 93 |
| 22122 Kenwood | Torrance | 1970 | 3 | 2 | 1,455 | 3,989 | $652 | $949,000 | 39 | 69 |
| 22443 Meyler Street | Torrance | 1927 | 3 | 2 | 1,487 | 5,063 | $518 | $771,000 | 97 | 66 |
| 1127 5th | Santa Ana | 1913 | 3 | 3 | 1,116 | 6,625 | $739 | $825,000 | 102 | 63 |
| Total: 5 · Average | 3.4 | 2.6 | 1,723.6 | 102,656.4 | $543.6 | $877,600 | 80.8 | |||
| Median | 1,487 | $918,000 | ||||||||
Closed Properties (5)
Closed Comparables
| Address | City | Year | Date | BD | BTH | SqFt | LotSz | LP | SP | SP/SqFt | SP/LP | DIM | Score |
|---|---|---|---|---|---|---|---|---|---|---|---|---|---|
| 22756 Meyler Street | Torrance | 2016 | 01/28/2026 | 5 | 3 | 2,058 | 64,132 | $1.03M | $1.03M | $500 | 1.00 | 48 | 71 |
| 1040 220th | Torrance | 1952 | 06/16/2026 | 4 | 4 | 1,894 | 5,185 | $764,000 | $805,000 | $425 | 1.05 | 69 | 71 |
| 555 Shadwell | Carson | 1959 | 08/03/2026 | 3 | 2 | 1,613 | 6,220 | $869,900 | $869,900 | $539 | 1.00 | 34 | 66 |
| 23033 Alexandria | Torrance | 1956 | 12/22/2025 | 5 | 3 | 1,738 | 7,557 | $845,000 | $855,000 | $492 | 1.01 | 75 | 65 |
| 1034 Gian Drive | Torrance | 1977 | 06/05/2026 | 3 | 2 | 1,542 | 4,427 | $985,000 | $969,000 | $628 | 0.98 | 84 | 64 |
| Total: 5 · Average | 4.0 | 2.8 | 1,769 | 17,504.2 | $905,780 | $905,780 | $516.8 | — | 62 | ||||
| Median | 1,738 | $869,900 | $869,900 | ||||||||||
Market Analysis
List vs Sale $/SqFt
Sale Price Trend
Days on Market
Sale vs List Price
This analysis was generated automatically from MLS data. For an in-depth, human-reviewed valuation, contact Joseph Sardella at josephsardella@gmail.com.