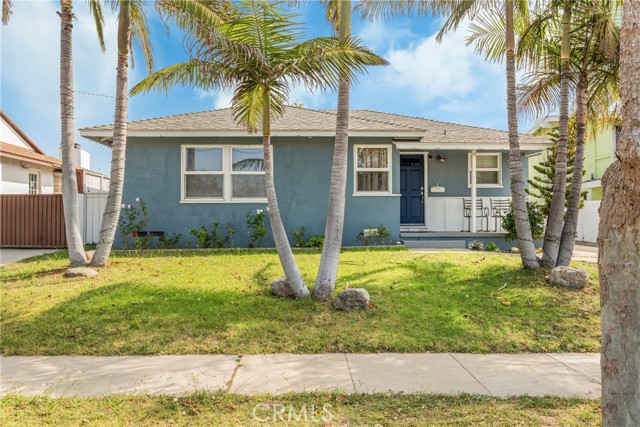
21514 Anza Avenue, Torrance, CA 90503
21514 Anza Avenue, Torrance, CA 90503
Property Description
Discover the charm and possibilities of 21514 Anza Ave in Torrance! This inviting 3-bedroom, 2-bath home offers 1,162 square feet of living space on a 5,401-square-foot lot. Three mature avocado trees bring a special touch to the property, offering the pleasure of fresh, homegrown avocados. Located approximately 15 minutes from the beach and just 5 minutes from Del Amo Fashion Center, you’ll enjoy easy access to shopping, dining, entertainment, and coastal adventures. Bring your vision and make this Torrance home your own!
Features & Amenities
Property Details
Mortgage Calculator
Current Rates
Comparative Market Analysis
Affordable Tier · 5 active · 5 closed
Torrance · Single Family Residence
Listed 8.3% below the median closed sale of $1,200,000. Closed comps sold at 103% of list — strong seller's market.
Price Position
Priced below the market — value advantage over the field.
Active Properties (5)
Active Comparables
| Address | City | Year | BD | BTH | SqFt | LotSz | LP/SqFt | LP | DIM | Score |
|---|---|---|---|---|---|---|---|---|---|---|
| 4757 Towers Street | Torrance | 1954 | 3 | 1 | 1,098 | 6,825 | $1,138 | $1.25M | 56 | 79 |
| 4609 191st Street | Torrance | 1954 | 3 | 2 | 1,392 | 6,916 | $898 | $1.25M | 11 | 75 |
| 1606 Armour | Redondo Beach | 1961 | 3 | 2 | 1,159 | 2,504 | $1,079 | $1.25M | 106 | 74 |
| 18406 Florwood Avenue | Torrance | 1956 | 3 | 2 | 1,215 | 5,414 | $807 | $980,000 | 106 | 73 |
| 2422 238th | Torrance | 1954 | 3 | 2 | 1,255 | 6,121 | $837 | $1.05M | 74 | 72 |
| Total: 5 · Average | 3.0 | 1.8 | 1,223.8 | 5,556 | $951.8 | $1.16M | 70.6 | |||
| Median | 1,215 | $1.25M | ||||||||
Closed Properties (5)
Closed Comparables
| Address | City | Year | Date | BD | BTH | SqFt | LotSz | LP | SP | SP/SqFt | SP/LP | DIM | Score |
|---|---|---|---|---|---|---|---|---|---|---|---|---|---|
| 21302 Kent | Torrance | 1956 | 09/09/2026 | 3 | 2 | 1,155 | 5,525 | $1.19M | $1.26M | $1,092 | 1.06 | 43 | 93 |
| 21733 Marjorie Avenue | Torrance | 1956 | 07/14/2026 | 3 | 2 | 1,162 | 5,501 | $1.22M | $1.20M | $1,032 | 0.98 | 76 | 93 |
| 4924 Carson | Torrance | 1955 | 09/30/2026 | 3 | 2 | 1,162 | 6,419 | $1.15M | $1.20M | $1,033 | 1.04 | 19 | 93 |
| 5124 Merrill Street | Torrance | 1955 | 10/20/2026 | 3 | 2 | 1,162 | 5,261 | $1.18M | $1.23M | $1,054 | 1.04 | 0 | 92 |
| 4623 Lenore | Torrance | 1955 | 05/14/2026 | 3 | 2 | 1,140 | 5,586 | $980,000 | $1.00M | $877 | 1.02 | 23 | 92 |
| Total: 5 · Average | 3.0 | 2.0 | 1,156.2 | 5,658.4 | $1.18M | $1.18M | $1,017.6 | — | 32.2 | ||||
| Median | 1,162 | $1.20M | $1.20M | ||||||||||
Market Analysis
List vs Sale $/SqFt
Sale Price Trend
Days on Market
Sale vs List Price
This analysis was generated automatically from MLS data. For an in-depth, human-reviewed valuation, contact Joseph Sardella at josephsardella@gmail.com.