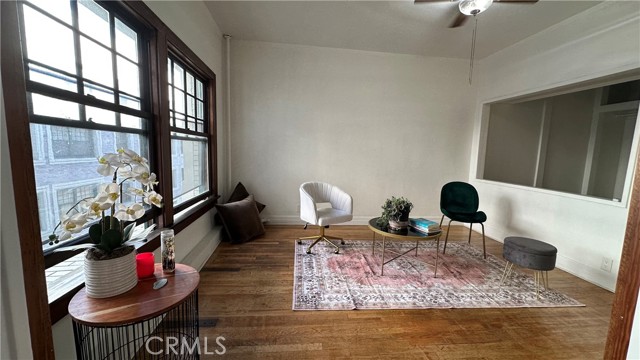
2121 West James M Wood Boulevard West, 316, Los Angeles, CA 90006
2121 West James M Wood Boulevard West, 316, Los Angeles, CA 90006
Property Description
New price. An excellent opportunity to own in historic Los AngelesBeautiful third floor unit in the historic Glen Donald Building, a 1923 Spanish Colonial Revival landmark. With the recent price reduction, this is an excellent opportunity for buyers looking to own in a prime Los Angeles location. Qualified buyers may also be eligible for lender-sponsored grants or down payment assistance programs, subject to program availability and lender approval. Enjoy convenient access to Downtown LA, USC, LA Live, Crypto.com Arena, BMO Stadium, Exposition Park, Koreatown, shopping, dining, and entertainment. Metro Rail and bus service, along with quick access to the 10, 110, and 101 Freeways, make commuting throughout Los Angeles convenient. Another major advantage is the low HOA fee, which includes all utilities, helping reduce monthly ownership expenses. Whether you're looking for a primary residence, a city retreat, or an investment opportunity, this property combines historic character, convenience, and value.
Features & Amenities
Property Details
Mortgage Calculator
Current Rates
Comparative Market Analysis
Affordable Tier · 2 active · 2 closed
Los Angeles · Condominium
Listed 6.7% below the median closed sale of $209,000. Price per sqft ($513) is a 18% premium to closed comps ($436). Closed comps sold at 102% of list — strong seller's market.
Price Position
Priced below the market — value advantage over the field.
Active Properties (2)
Active Comparables
| Address | City | Year | BD | BTH | SqFt | LotSz | LP/SqFt | LP | DIM | Score |
|---|---|---|---|---|---|---|---|---|---|---|
| 2121 James M Wood | Los Angeles | 1923 | 0 | 1 | 370 | 21,313 | $540 | $199,900 | 25 | 97 |
| 1119 Albany Street | Los Angeles | 1983 | 1 | 1 | 845 | 0 | $222 | $187,800 | 31 | 58 |
| Total: 2 · Average | 0.5 | 1.0 | 607.5 | 21,313 | $381 | $193,850 | 28 | |||
| Median | 845 | $199,900 | ||||||||
Closed Properties (2)
Closed Comparables
| Address | City | Year | Date | BD | BTH | SqFt | LotSz | LP | SP | SP/SqFt | SP/LP | DIM | Score |
|---|---|---|---|---|---|---|---|---|---|---|---|---|---|
| 320 Ardmore Avenue | Los Angeles | 1973 | 10/21/2026 | 0 | 1 | 378 | 43,946 | $210,000 | $208,000 | $550 | 0.99 | 156 | 69 |
| 1119 Albany | Los Angeles | 1983 | 10/07/2026 | 1 | 1 | 650 | 147,380 | $200,000 | $210,000 | $323 | 1.05 | 40 | 62 |
| Total: 2 · Average | 0.5 | 1.0 | 514 | 95,663 | $209,000 | $209,000 | $436.5 | — | 98 | ||||
| Median | 650 | $210,000 | $210,000 | ||||||||||
Market Analysis
List vs Sale $/SqFt
Sale Price Trend
Days on Market
Sale vs List Price
This analysis was generated automatically from MLS data. For an in-depth, human-reviewed valuation, contact Joseph Sardella at josephsardella@gmail.com.