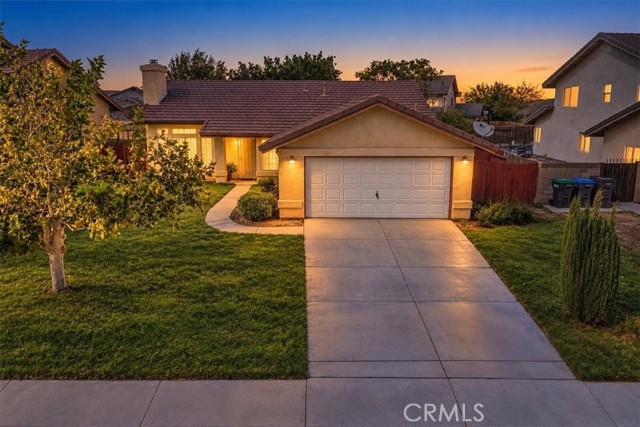
2113 Lightcap, Lancaster, CA 93535
2113 Lightcap, Lancaster, CA 93535
Property Description
Welcome to this inviting home offering a clean slate for families to make it their own. Featuring generously sized rooms and a versatile bonus room, the property provides plenty of space for comfortable living, entertaining, or creating a dedicated home office, playroom, or hobby space. The spacious layout offers flexibility for a variety of lifestyles, while the two-car garage provides convenient parking and additional storage. With its well-maintained condition and opportunity to add your own personal touches, this home is ready for its next owner!
Features & Amenities
Property Details
Mortgage Calculator
Current Rates
Comparative Market Analysis
Affordable Tier · 5 active · 5 closed
Lancaster · Single Family Residence
Listed in line with the median closed sale of $435,000. Closed comps sold at 101% of list — strong seller's market.
Price Position
Aligned with the market — fair pricing for the comps.
Active Properties (5)
Active Comparables
| Address | City | Year | BD | BTH | SqFt | LotSz | LP/SqFt | LP | DIM | Score |
|---|---|---|---|---|---|---|---|---|---|---|
| 1800 Sierra View | Lancaster | 1990 | 3 | 2 | 1,316 | 6,097 | $304 | $399,999 | 25 | 90 |
| 44630 17th E, | Lancaster | 1990 | 3 | 3 | 1,581 | 5,790 | $240 | $380,000 | 108 | 90 |
| 2110 Lightcap Street | Lancaster | 2001 | 3 | 3 | 1,751 | 7,553 | $251 | $439,999 | 9 | 88 |
| 1768 Sierra View Avenue | Lancaster | 1989 | 3 | 3 | 1,741 | 6,195 | $247 | $429,999 | 57 | 87 |
| 44535 Aspen | Lancaster | 1993 | 4 | 3 | 1,637 | 7,103 | $275 | $449,900 | 32 | 85 |
| Total: 5 · Average | 3.2 | 2.8 | 1,605.2 | 6,547.6 | $263.4 | $419,979.4 | 46.2 | |||
| Median | 1,637 | $429,999 | ||||||||
Closed Properties (5)
Closed Comparables
| Address | City | Year | Date | BD | BTH | SqFt | LotSz | LP | SP | SP/SqFt | SP/LP | DIM | Score |
|---|---|---|---|---|---|---|---|---|---|---|---|---|---|
| 44937 Gloriosa Lane | Lancaster | 1990 | 09/01/2026 | 3 | 2 | 1,389 | 6,658 | $399,950 | $415,000 | $299 | 1.04 | 43 | 91 |
| 1745 Norberry Street | Lancaster | 1989 | 11/06/2026 | 3 | 3 | 1,581 | 6,162 | $465,000 | $470,000 | $297 | 1.01 | 98 | 87 |
| 2340 Lightcap Street | Lancaster | 1990 | 07/21/2026 | 4 | 2 | 1,534 | 1,389 | $424,900 | $424,900 | $277 | 1.00 | 68 | 87 |
| 2018 Jenner | Lancaster | 2007 | 02/25/2026 | 3 | 2 | 1,890 | 6,898 | $429,900 | $435,000 | $230 | 1.01 | 34 | 83 |
| 44509 21st | Lancaster | 1993 | 09/28/2026 | 4 | 3 | 1,763 | 5,356 | $499,000 | $499,000 | $283 | 1.00 | 32 | 82 |
| Total: 5 · Average | 3.4 | 2.4 | 1,631.4 | 5,292.6 | $448,780 | $448,780 | $277.2 | — | 55 | ||||
| Median | 1,581 | $435,000 | $435,000 | ||||||||||
Market Analysis
List vs Sale $/SqFt
Sale Price Trend
Days on Market
Sale vs List Price
This analysis was generated automatically from MLS data. For an in-depth, human-reviewed valuation, contact Joseph Sardella at josephsardella@gmail.com.