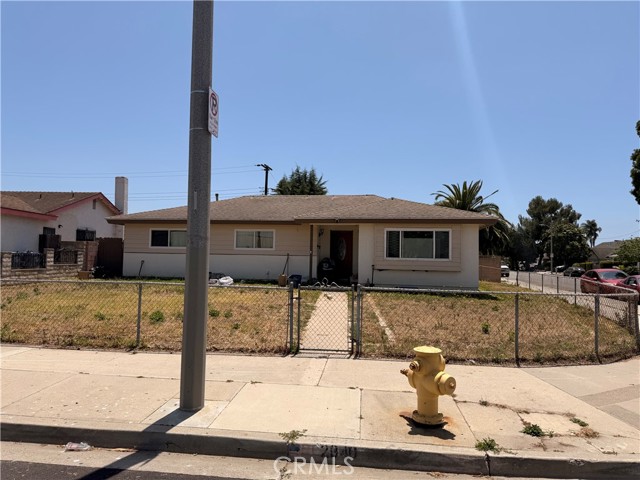
2040 Curran Street, Oxnard, CA 93033
2040 Curran Street, Oxnard, CA 93033
Property Description
Coastal Oxnard opportunity! This single-level 3 bed, 2 bath home offers approx. 1,458 sq ft on an approx. 7,100 sq ft lot in southeast Oxnard. Built in 1968, it is a great fit for buyers ready to build equity or investors looking for a value-add project. Ormond Beach and Port Hueneme Beach Park are about 3 miles away, Silver Strand, Hollywood Beach and Channel Islands Harbor are about 15 minutes away, and Oxnard College is under 3 miles away, with easy access to shopping and US-101. Bring your vision to this beach-area location!
Features & Amenities
Property Details
Mortgage Calculator
Current Rates
Comparative Market Analysis
Affordable Tier · 5 active · 5 closed
Not Applicable · Oxnard · Single Family Residence
Listed 4.7% below the median closed sale of $760,500. Closed comps sold at 104% of list — strong seller's market.
Price Position
Aligned with the market — fair pricing for the comps.
Active Properties (5)
Active Comparables
| Address | City | Year | BD | BTH | SqFt | LotSz | LP/SqFt | LP | DIM | Score |
|---|---|---|---|---|---|---|---|---|---|---|
| 861 Morro Way | Oxnard | 1966 | 3 | 2 | 1,144 | 6,098 | $628 | $719,000 | 102 | 85 |
| 3600 J Street | Oxnard | 1959 | 3 | 2 | 1,738 | 6,081 | $388 | $675,000 | 4 | 77 |
| 4912 Bradfield Place | Oxnard | 1953 | 3 | 2 | 960 | 6,136 | $833 | $799,999 | 52 | 73 |
| 3036 A Street | Oxnard | 1955 | 4 | 2 | 1,233 | 6,056 | $568 | $700,000 | 3 | 72 |
| 3560 San Simeon Avenue | Oxnard | 1966 | 5 | 4 | 2,032 | 6,098 | $381 | $775,000 | 107 | 69 |
| Total: 5 · Average | 3.6 | 2.4 | 1,421.4 | 6,093.8 | $559.6 | $733,799.8 | 53.6 | |||
| Median | 1,233 | $719,000 | ||||||||
Closed Properties (5)
Closed Comparables
| Address | City | Year | Date | BD | BTH | SqFt | LotSz | LP | SP | SP/SqFt | SP/LP | DIM | Score |
|---|---|---|---|---|---|---|---|---|---|---|---|---|---|
| 2154 Curran Street | Oxnard | 1968 | 05/21/2026 | 3 | 2 | 1,447 | 5,662 | $725,000 | $775,000 | $536 | 1.07 | 29 | 95 |
| 4720 Reeder Avenue | Oxnard | 1968 | 05/21/2026 | 3 | 2 | 1,416 | 5,662 | $649,900 | $680,000 | $480 | 1.05 | 45 | 89 |
| 2064 WALDEN Street | Oxnard | 1968 | 12/17/2025 | 4 | 2 | 1,615 | 6,098 | $675,000 | $690,000 | $427 | 1.02 | 83 | 85 |
| 1960 Peoria Place | Oxnard | 1969 | 01/30/2026 | 3 | 3 | 1,696 | 5,662 | $805,000 | $805,000 | $475 | 1.00 | 52 | 84 |
| 4200 Browning | Oxnard | 1978 | 04/03/2026 | 3 | 3 | 1,810 | 6,098 | $724,999 | $760,500 | $420 | 1.05 | 36 | 81 |
| Total: 5 · Average | 3.2 | 2.4 | 1,596.8 | 5,836.4 | $742,100 | $742,100 | $467.6 | — | 49 | ||||
| Median | 1,615 | $760,500 | $760,500 | ||||||||||
Market Analysis
List vs Sale $/SqFt
Sale Price Trend
Days on Market
Sale vs List Price
This analysis was generated automatically from MLS data. For an in-depth, human-reviewed valuation, contact Joseph Sardella at josephsardella@gmail.com.