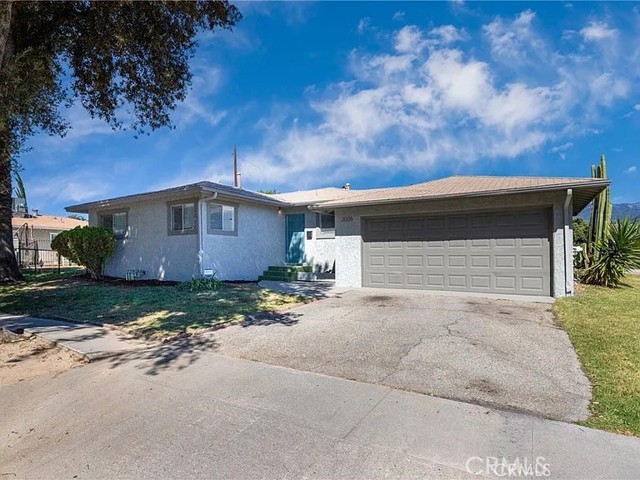
1 / 1
2006 Medical Center, San Bernardino, CA 92411
$390K3bd · 2ba · 1,078 sqft
Lot 7,280 sqft•Single Family Residence•Active•16d on market•MLS# CV-26092792
2006 Medical Center, San Bernardino, CA 92411
MLS# CV-26092792•Residential•Single Family Residence
Active16 days on market
$390,000
3
Beds
2
Baths
1,078
Sq Ft
7,280
Lot Sq Ft
1955
Year Built
None
View
Property Description
Great opportunity in San Bernardino! This property offers a functional layout with convenient access to major freeways, shopping, dining, and nearby medical facilities. Ideal for first-time buyers or investors.
Features & Amenities
FeeBuilt 1955
Property Details
Land Type
Fee
Year Built
1955
Property Type
Residential
Property Subtype
Single Family Residence
Parking Spaces
2
Garage Spaces
2
Heating
Central
Cooling
Central Air
View
None
City
San Bernardino
Zip Code
92411
County
San Bernardino
Mortgage Calculator
Current Rates
$
$
%
Monthly Payment
$1,972.05
Principal & Interest
Loan Amount
$312,000
Total Interest
$397,939
Total Payment Over 30 Years
$709,939
This calculator provides estimates only. Actual mortgage payments may include taxes, insurance, HOA fees, and PMI. Contact a lender for accurate quotes.
Comparative Market Analysis
Affordable Tier · 5 active · 5 closed
2006 Medical Center, San Bernardino, CA 92411
San Bernardino · Single Family Residence
$390K
Affordable TierBeds
3
Baths
2
Sqft
1,078
Lot
7,280 sqft
Year
1955
$/Sqft
$362
Pool: No✓
View: None✓
Garage: 2-car✓
Listed 4.9% below the median closed sale of $410,000. Price per sqft ($362) is a 16% premium to closed comps ($311).
Price Position
Aligned with the market — fair pricing for the comps.
At market
Subject listed at $390K· $362/sqft
Total list price
Closed comps
vs closed median $410K
−$20K (−4.9%)
Active comps
vs active median $400K
−$10K (−2.5%)
Price per sqft
Closed compsinsufficient comp data
Active comps
vs active avg $/sqft $398
−$36 (−9.0%)
Active Properties (5)
Active Comparables
| Address | City | Year | BD | BTH | SqFt | LotSz | LP/SqFt | LP | DIM | Score |
|---|---|---|---|---|---|---|---|---|---|---|
| 1032 23rd Street | San Bernardino | 1946 | 3 | 2 | 1,161 | 8,160 | $370 | $430,000 | 20 | 87 |
| 1849 30th | San Bernardino | 1962 | 3 | 1 | 1,188 | 7,500 | $311 | $368,888 | 48 | 85 |
| 2843 California | San Bernardino | 1954 | 4 | 2 | 960 | 7,200 | $417 | $400,000 | 20 | 83 |
| 1875 Darby Street | San Bernardino | 1951 | 2 | 2 | 940 | 9,000 | $473 | $445,000 | 60 | 80 |
| 1156 Medical Center Drive | San Bernardino | 1959 | 2 | 1 | 930 | 5,031 | $418 | $389,000 | 77 | 77 |
| Total: 5 · Average | 2.8 | 1.6 | 1,035.8 | 7,378.2 | $397.8 | $406,577.6 | 45 | |||
| Median | 960 | $400,000 | ||||||||
Closed Properties (5)
Closed Comparables
| Address | City | Year | Date | BD | BTH | SqFt | LotSz | LP | SP | SP/SqFt | SP/LP | DIM | Score |
|---|---|---|---|---|---|---|---|---|---|---|---|---|---|
| 1541 16th | San Bernardino | 1955 | 04/14/2026 | 3 | 2 | 1,062 | 7,140 | $375,000 | $375,000 | $353 | 1.00 | 56 | 93 |
| 2226 Ramona | San Bernardino | 1953 | 09/15/2026 | 3 | 1 | 903 | 7,245 | $435,000 | $335,000 | $371 | 0.77 | 41 | 87 |
| 1578 Gilbert | San Bernardino | 1955 | 04/17/2026 | 3 | 2 | 1,598 | 7,245 | $430,000 | $438,000 | $274 | 1.02 | 87 | 82 |
| 1569 16th Street | San Bernardino | 1955 | 07/14/2026 | 3 | 1 | 1,438 | 7,140 | $425,000 | $430,000 | $299 | 1.01 | 70 | 81 |
| 1552 Evans | San Bernardino | 1955 | 08/21/2026 | 4 | 2 | 1,600 | 7,140 | $350,000 | $410,000 | $256 | 1.17 | 35 | 81 |
| Total: 5 · Average | 3.2 | 1.6 | 1,320.2 | 7,182 | $397,600 | $397,600 | $310.6 | — | 57.8 | ||||
| Median | 1,438 | $410,000 | $410,000 | ||||||||||
Market Analysis
List vs Sale $/SqFt
Sale Price Trend
Days on Market
Sale vs List Price
AI-generated CMA
This analysis was generated automatically from MLS data. For an in-depth, human-reviewed valuation, contact Joseph Sardella at josephsardella@gmail.com.