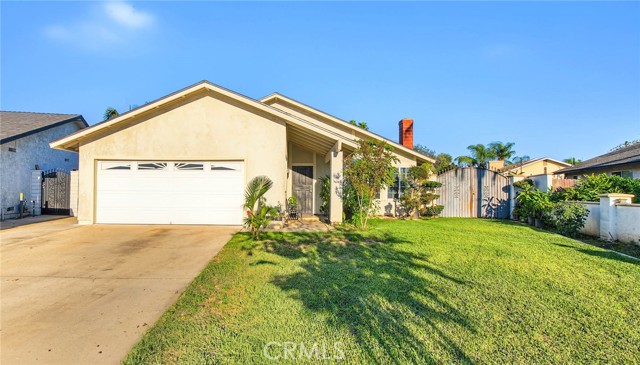
1949 South Palm Place, Ontario, CA 91762
1949 South Palm Place, Ontario, CA 91762
Property Description
Welcome home to this single-story residence nestled on a cul-de-sac in Ontario! Featuring 3 bedrooms, 2 bathrooms, approximately 1,242 square feet of living space, this home offers a comfortable setting to make your own. A landscaped front yard and attached two-car garage welcome you, while the spacious backyard. Perfect for weekend barbecues and outdoor entertaining. A side gate provides additional access to the backyard. Conveniently located near schools, shopping, and everyday amenities, with easy access to the 60 Freeway.
Features & Amenities
Property Details
Mortgage Calculator
Current Rates
Comparative Market Analysis
Affordable Tier · 5 active · 5 closed
Ontario · Single Family Residence
Listed 5.9% below the median closed sale of $722,500. Closed comps sold at 101% of list — strong seller's market.
Price Position
Priced below the market — value advantage over the field.
Active Properties (5)
Active Comparables
| Address | City | Year | BD | BTH | SqFt | LotSz | LP/SqFt | LP | DIM | Score |
|---|---|---|---|---|---|---|---|---|---|---|
| 1911 Holly Avenue | Ontario | 1964 | 3 | 2 | 1,456 | 9,000 | $440 | $640,000 | 65 | 88 |
| 649 Fairfield Court | Ontario | 1979 | 3 | 2 | 1,463 | 4,800 | $444 | $650,000 | 171 | 83 |
| 12218 Kumquat | Chino | 1972 | 4 | 2 | 1,530 | 7,350 | $476 | $729,000 | 86 | 82 |
| 122 De Anza Circle | Ontario | 1953 | 3 | 1 | 990 | 6,750 | $596 | $589,900 | 45 | 77 |
| 1758 Briar Avenue | Ontario | 1974 | 4 | 3 | 1,873 | 7,625 | $416 | $780,000 | 20 | 73 |
| Total: 5 · Average | 3.4 | 2.0 | 1,462.4 | 7,105 | $474.4 | $677,780 | 77.4 | |||
| Median | 1,463 | $650,000 | ||||||||
Closed Properties (5)
Closed Comparables
| Address | City | Year | Date | BD | BTH | SqFt | LotSz | LP | SP | SP/SqFt | SP/LP | DIM | Score |
|---|---|---|---|---|---|---|---|---|---|---|---|---|---|
| 502 Grevillea | Ontario | 1983 | 05/26/2026 | 3 | 2 | 1,260 | 8,160 | $699,000 | $722,500 | $573 | 1.03 | 39 | 92 |
| 2009 Plum Avenue | Ontario | 1975 | 11/10/2026 | 4 | 2 | 1,225 | 7,443 | $735,000 | $735,000 | $600 | 1.00 | 26 | 92 |
| 2152 Cherry | Ontario | 1974 | 09/14/2026 | 4 | 2 | 1,488 | 7,200 | $675,000 | $680,000 | $457 | 1.01 | 65 | 87 |
| 2158 HOLLY AVE | Ontario | 1976 | 10/05/2026 | 3 | 2 | 1,768 | 7,150 | $738,000 | $720,000 | $407 | 0.98 | 53 | 83 |
| 221 Maple Street | Ontario | 1965 | 05/12/2026 | 4 | 2 | 1,427 | 13,680 | $749,999 | $780,000 | $547 | 1.04 | 118 | 81 |
| Total: 5 · Average | 3.6 | 2.0 | 1,433.6 | 8,726.6 | $727,500 | $727,500 | $516.8 | — | 60.2 | ||||
| Median | 1,427 | $722,500 | $722,500 | ||||||||||
Market Analysis
List vs Sale $/SqFt
Sale Price Trend
Days on Market
Sale vs List Price
This analysis was generated automatically from MLS data. For an in-depth, human-reviewed valuation, contact Joseph Sardella at josephsardella@gmail.com.