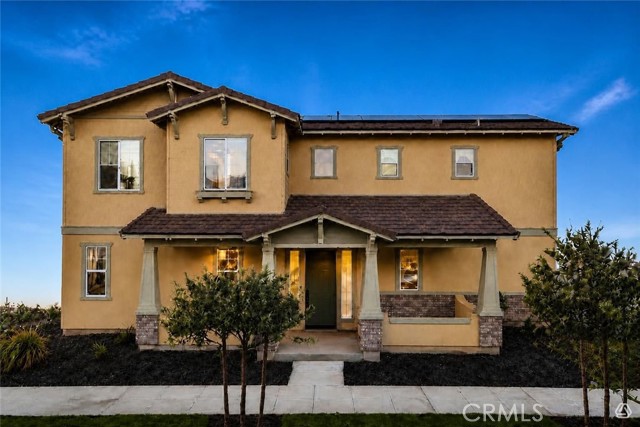
176 Lantana Street, Fillmore, CA 93015
176 Lantana Street, Fillmore, CA 93015
Property Description
Discover the appeal of this detached two-story residence in the desirable East Bridge at Heritage Grove subdivision. Offering 4 bedrooms, 2.5 bathrooms, and approximately 1,843 square feet of living space, this property provides room to grow, gather, and make lasting memories. The two-story design offers a natural separation between living and resting spaces, creating flexibility for everyday routines, entertaining, or accommodating guests. Beyond the home, enjoy community amenities that add to the lifestyle, including a swimming pool for warm sunny days, a clubhouse for gatherings, and a playground for outdoor fun. Whether you’re looking for a place to settle in, entertain, or enjoy the benefits of a welcoming community, this property offers an inviting opportunity to make yourself at home.
Features & Amenities
Property Details
Mortgage Calculator
Current Rates
Comparative Market Analysis
Residential Tier · 5 active · 5 closed
Fillmore · Single Family Residence
Listed 4.5% above the median closed sale of $669,000.
Price Position
Aligned with the market — fair pricing for the comps.
Active Properties (5)
Active Comparables
| Address | City | Year | BD | BTH | SqFt | LotSz | LP/SqFt | LP | DIM | Score |
|---|---|---|---|---|---|---|---|---|---|---|
| 162 Marigold Street | Fillmore | 2021 | 3 | 3 | 1,917 | 3,525 | $375 | $719,000 | 10 | 80 |
| 142 Cherrywood Street | Fillmore | 2013 | 3 | 3 | 1,973 | 1,973 | $354 | $699,000 | 53 | 75 |
| 44 Clearwood Street | Fillmore | 2026 | 3 | 3 | 2,327 | 8,630 | $342 | $796,740 | 148 | 70 |
| 639 Chapparel Street | Fillmore | 1977 | 4 | 3 | 2,068 | 7,380 | $384 | $795,000 | 28 | 55 |
| 113 Surrey | Fillmore | 1980 | 3 | 2 | 1,122 | 1,742 | $575 | $644,900 | 44 | 53 |
| Total: 5 · Average | 3.2 | 2.8 | 1,881.4 | 4,650 | $406 | $730,928 | 56.6 | |||
| Median | 1,973 | $719,000 | ||||||||
Closed Properties (5)
Closed Comparables
| Address | City | Year | Date | BD | BTH | SqFt | LotSz | LP | SP | SP/SqFt | SP/LP | DIM | Score |
|---|---|---|---|---|---|---|---|---|---|---|---|---|---|
| 339 Hydrangea Street | Fillmore | 2023 | 10/16/2026 | 3 | 3 | 1,612 | 2,519 | $650,000 | $640,000 | $397 | 0.98 | 70 | 84 |
| 252 Driftwood Street | Fillmore | 2013 | 05/04/2026 | 4 | 3 | 1,751 | 3,217 | $674,900 | $669,000 | $382 | 0.99 | 88 | 79 |
| 158 Arborwood | Fillmore | 2016 | 06/04/2026 | 4 | 3 | 1,742 | 38,611 | $679,000 | $660,000 | $379 | 0.97 | 88 | 70 |
| 264 Rose Street | Fillmore | 2021 | 04/13/2026 | 3 | 3 | 2,000 | 6,969 | $800,000 | $795,000 | $398 | 0.99 | 46 | 68 |
| 444 Mountain View Street | Fillmore | 1968 | 06/12/2026 | 4 | 2 | 1,519 | 6,500 | $755,000 | $750,000 | $494 | 0.99 | 83 | 67 |
| Total: 5 · Average | 3.6 | 2.8 | 1,724.8 | 11,563.2 | $702,800 | $702,800 | $410 | — | 75 | ||||
| Median | 1,742 | $669,000 | $669,000 | ||||||||||
Market Analysis
List vs Sale $/SqFt
Sale Price Trend
Days on Market
Sale vs List Price
This analysis was generated automatically from MLS data. For an in-depth, human-reviewed valuation, contact Joseph Sardella at josephsardella@gmail.com.