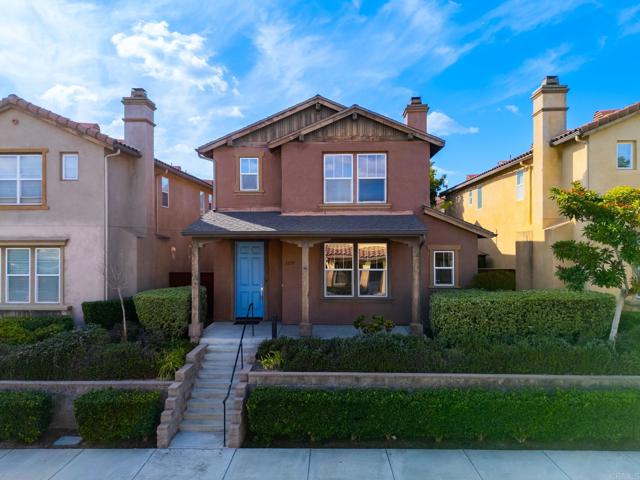
1575 Moonbeam Lane, Chula Vista, CA 91915
1575 Moonbeam Lane, Chula Vista, CA 91915
Property Description
Spacious, bright 4-bedroom home in the desirable Winding Walk community of Eastlake! Freshly painted with new flooring in select areas, this inviting home offers a refreshed feel and abundant natural light. Enjoy a convenient location near highly regarded schools, neighborhood parks, and walking paths. Otay Ranch Town Center is close by, offering shopping, restaurants, a movie theater, and everyday essentials. A wonderful opportunity to enjoy comfort and convenience in eastern Chula Vista!
Features & Amenities
Property Details
Mortgage Calculator
Current Rates
Comparative Market Analysis
Residential Tier · 5 active · 5 closed
Chula Vista · Single Family Residence
Listed 8.4% below the median closed sale of $905,000. Price per sqft ($400) is a 11% discount to closed comps ($450). Closed comps sold at 101% of list — strong seller's market.
Price Position
Priced below the market — value advantage over the field.
Active Properties (5)
Active Comparables
| Address | City | Year | BD | BTH | SqFt | LotSz | LP/SqFt | LP | DIM | Score |
|---|---|---|---|---|---|---|---|---|---|---|
| 1817 Olive Green Street | Chula Vista | 2013 | 3 | 3 | 2,097 | 0 | $405 | $849,900 | 93 | 77 |
| 1414 Hidden Springs Place | Chula Vista | 2001 | 4 | 3 | 1,911 | 3,351 | $492 | $940,000 | 9 | 75 |
| 1974 STRATA Street | Chula Vista | 2020 | 3 | 4 | 2,670 | 0 | $324 | $864,999 | 37 | 71 |
| 1859 Posh Lane | Chula Vista | 2021 | 4 | 3 | 1,681 | 10,000 | $463 | $779,000 | 16 | 71 |
| 1858 Wedgewood Pl | Chula Vista | 2009 | 3 | 4 | 1,822 | 409,028 | $443 | $808,000 | 136 | 69 |
| Total: 5 · Average | 3.4 | 3.4 | 2,036.2 | 140,793 | $425.4 | $848,379.8 | 58.2 | |||
| Median | 1,911 | $849,900 | ||||||||
Closed Properties (5)
Closed Comparables
| Address | City | Year | Date | BD | BTH | SqFt | LotSz | LP | SP | SP/SqFt | SP/LP | DIM | Score |
|---|---|---|---|---|---|---|---|---|---|---|---|---|---|
| 2284 Red Leaf Lane | Chula Vista | 2005 | 10/23/2026 | 4 | 3 | 2,375 | 1,117,750 | $899,999 | $905,000 | $381 | 1.01 | 62 | 97 |
| 2233 Capistrano Way | Chula Vista | 2010 | 07/02/2026 | 4 | 3 | 1,993 | 618,552 | $860,000 | $855,000 | $429 | 0.99 | 52 | 81 |
| 2194 Honeybee Street | Chula Vista | 2005 | 05/13/2026 | 3 | 3 | 1,788 | 3,485 | $899,900 | $930,000 | $520 | 1.03 | 27 | 76 |
| 2475 Myrtle Beach Way | Chula Vista | 1998 | 06/12/2026 | 3 | 3 | 1,593 | 5,227 | $950,000 | $940,000 | $590 | 0.99 | 24 | 76 |
| 3323 Avocado Vista | Fallbrook | 1999 | 08/03/2026 | 4 | 3 | 2,437 | 5,227 | $799,000 | $810,000 | $332 | 1.01 | 61 | 74 |
| Total: 5 · Average | 3.6 | 3.0 | 2,037.2 | 350,048.2 | $888,000 | $888,000 | $450.4 | — | 45.2 | ||||
| Median | 1,993 | $905,000 | $905,000 | ||||||||||
Market Analysis
List vs Sale $/SqFt
Sale Price Trend
Days on Market
Sale vs List Price
This analysis was generated automatically from MLS data. For an in-depth, human-reviewed valuation, contact Joseph Sardella at josephsardella@gmail.com.