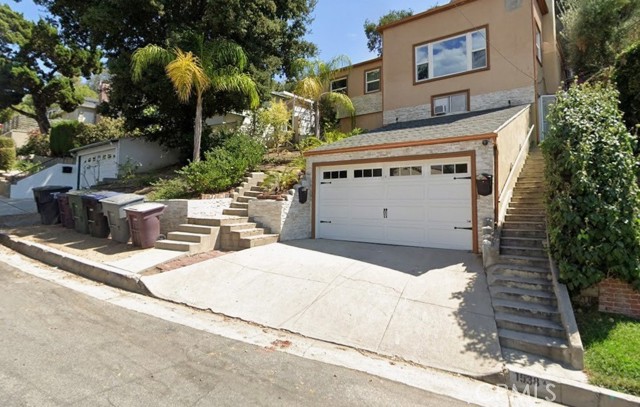
1 / 2
1538 East Maple, Glendale, CA 91205
$850K2bd · 1ba · 1,296 sqft
Lot 7,765 sqft•Single Family Residence•Active•110d on market•MLS# GD-26165863
1538 East Maple, Glendale, CA 91205
MLS# GD-26165863•Residential•Single Family Residence
Active110 days on market
$850,000
2
Beds
1
Baths
1,296
Sq Ft
7,765
Lot Sq Ft
1938
Year Built
Property Description
Centrally located walking distance from a park, surrounded by great schools and community. The property is in distressed sale, short sale with final price and terms subject to lender's final approval. Please email the listing office to arrange the showing and do not show up at the property unannounced.
Features & Amenities
FeeBuilt 1938
Property Details
Land Type
Fee
Year Built
1938
Property Type
Residential
Property Subtype
Single Family Residence
Parking Spaces
2
Garage Spaces
2
Cooling
Wall/Window Unit(s)
City
Glendale
Zip Code
91205
County
Los Angeles
Mortgage Calculator
Current Rates
$
$
%
Monthly Payment
$4,298.06
Principal & Interest
Loan Amount
$680,000
Total Interest
$867,303
Total Payment Over 30 Years
$1,547,303
This calculator provides estimates only. Actual mortgage payments may include taxes, insurance, HOA fees, and PMI. Contact a lender for accurate quotes.
Comparative Market Analysis
Affordable Tier · 5 active · 5 closed
1538 East Maple, Glendale, CA 91205
Glendale · Single Family Residence
$850K
Affordable TierBeds
2
Baths
1
Sqft
1,296
Lot
7,765 sqft
Year
1938
$/Sqft
$656
Pool: No✓
Garage: 2-car✓
Listed 8.1% below the median closed sale of $925,000.
Price Position
Priced below the market — value advantage over the field.
Price advantage
Subject listed at $850K· $656/sqft
Total list price
Closed comps
vs closed median $925K
−$75K (−8.1%)
Active comps
vs active median $899K
−$49K (−5.5%)
Price per sqft
Closed compsinsufficient comp data
Active comps
vs active avg $/sqft $900
−$244 (−27.1%)
Active Properties (5)
Active Comparables
| Address | City | Year | BD | BTH | SqFt | LotSz | LP/SqFt | LP | DIM | Score |
|---|---|---|---|---|---|---|---|---|---|---|
| 1370 Acacia Avenue | Glendale | 1947 | 3 | 1 | 1,385 | 8,049 | $692 | $959,000 | 11 | 86 |
| 811 Fischer Street | Glendale | 1925 | 2 | 2 | 977 | 3,533 | $947 | $925,000 | 116 | 79 |
| 1030 Tyler St | Glendale | 1924 | 2 | 2 | 1,116 | 3,545 | $806 | $899,000 | 139 | 79 |
| 4216 Panamint Street | Los Angeles | 1952 | 2 | 1 | 1,144 | 4,718 | $743 | $849,999 | 204 | 75 |
| 4445 Mont Eagle | Los Angeles | 1923 | 2 | 1 | 560 | 7,120 | $1,312 | $735,000 | 60 | 68 |
| Total: 5 · Average | 2.2 | 1.4 | 1,036.4 | 5,393 | $900 | $873,599.8 | 106 | |||
| Median | 1,116 | $899,000 | ||||||||
Closed Properties (5)
Closed Comparables
| Address | City | Year | Date | BD | BTH | SqFt | LotSz | LP | SP | SP/SqFt | SP/LP | DIM | Score |
|---|---|---|---|---|---|---|---|---|---|---|---|---|---|
| 807 S Verdugo Rd | Glendale | 1940 | 04/22/2026 | 2 | 2 | 1,311 | 5,567 | $924,888 | $878,370 | $670 | 0.95 | 86 | 86 |
| 808 Verdugo Road | Glendale | 1927 | 02/20/2026 | 2 | 1 | 1,260 | 4,102 | $927,000 | $927,000 | $736 | 1.00 | 0 | 85 |
| 5233 Lockhaven Avenue | Los Angeles | 1921 | 06/24/2026 | 3 | 1 | 1,172 | 6,649 | $998,000 | $925,000 | $789 | 0.93 | 25 | 82 |
| 3205 Palmer Drive | Los Angeles | 1942 | 12/02/2025 | 2 | 1 | 893 | 4,500 | $749,900 | $857,000 | $960 | 1.14 | 41 | 79 |
| 5271 Eagle Dale | Los Angeles | 2025 | 09/30/2026 | 3 | 3 | 2,030 | 1,877 | $998,000 | $960,000 | $473 | 0.96 | 123 | 63 |
| Total: 5 · Average | 2.4 | 1.6 | 1,333.2 | 4,539 | $909,474 | $909,474 | $725.6 | — | 55 | ||||
| Median | 1,260 | $925,000 | $925,000 | ||||||||||
Market Analysis
List vs Sale $/SqFt
Sale Price Trend
Days on Market
Sale vs List Price
AI-generated CMA
This analysis was generated automatically from MLS data. For an in-depth, human-reviewed valuation, contact Joseph Sardella at josephsardella@gmail.com.