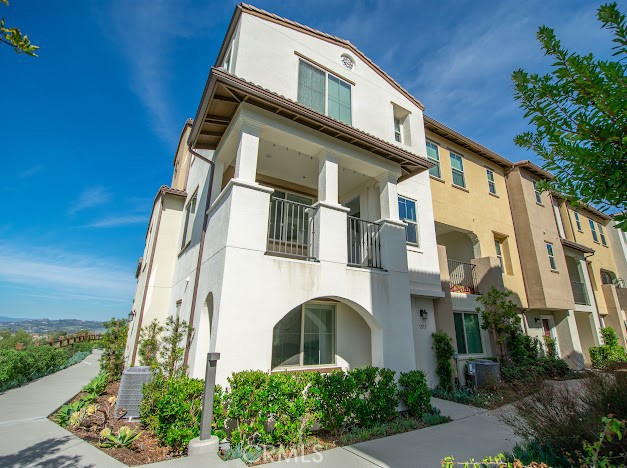
1517 Redbud, Oceanside, CA 92056
1517 Redbud, Oceanside, CA 92056
Property Description
Three story corner unit located in the desirable community of Melrose Heights. This spacious 3 bedroom 3.5 bath home features every bedroom with its own private en suite bathroom plus an additional half bath in the main living area. The main floor offers a modern open floor plan layout seamlessly integrates the cooking dining and living spaces with laundry room half bath and a balcony designed for both functionality and for entertaining. Enjoy beautiful sunset and city light views from balcony. Melrose Community resort style amenities include swimming pool, spa, BBQ areas, fire pit, playground and walking areas. The two car garage has a 220v washer dryer hook up for additional laundry convenience on the ground floor. This beautiful home is a short drive to Oceanside Pier, the Marina, beach, restaurants, shopping and comes with Paid Solar.
Features & Amenities
Property Details
Mortgage Calculator
Current Rates
About Oceanside
This property is located in Oceanside, a community in Oceanside. Explore more listings in this neighborhood to compare options and pricing.
View Oceanside ListingsComparative Market Analysis
Residential Tier · 3 active · 5 closed
Oceanside · Oceanside · Condominium
Listed 6.7% above the median closed sale of $749,000.
Price Position
Positioned above the market — commands a premium.
Active Properties (3)
Active Comparables
| Address | City | Year | BD | BTH | SqFt | LotSz | LP/SqFt | LP | DIM | Score |
|---|---|---|---|---|---|---|---|---|---|---|
| 1724 Valley Oak Way | Oceanside | 2023 | 4 | 3 | 2,143 | 0 | $396 | $849,000 | 29 | 90 |
| 1836 Red Willow Way | Oceanside | 2023 | 3 | 3 | 1,618 | 0 | $460 | $745,000 | 82 | 67 |
| 1862 Morning View Drive | Vista | 2002 | 3 | 3 | 1,458 | 0 | $514 | $750,000 | 59 | 61 |
| Total: 3 · Average | 3.3 | 3.0 | 1,739.667 | 0 | $456.667 | $781,333.333 | 56.666666666666664 | |||
| Median | 1,618 | $750,000 | ||||||||
Closed Properties (5)
Closed Comparables
| Address | City | Year | Date | BD | BTH | SqFt | LotSz | LP | SP | SP/SqFt | SP/LP | DIM | Score |
|---|---|---|---|---|---|---|---|---|---|---|---|---|---|
| 1610 Holly Leaf | Oceanside | 2023 | 07/16/2026 | 4 | 4 | 1,767 | 355,891 | $825,000 | $810,000 | $458 | 0.98 | 50 | 96 |
| 1832 Red Willow | Oceanside | 2023 | 12/15/2025 | 3 | 3 | 2,193 | 0 | $758,000 | $725,000 | $331 | 0.96 | 67 | 77 |
| 1191 Via Lucero | Oceanside | 2021 | 04/20/2026 | 3 | 4 | 1,569 | 233,131 | $749,000 | $749,000 | $477 | 1.00 | 31 | 76 |
| 1207 Via Lucero | Oceanside | 2021 | 12/03/2025 | 4 | 4 | 1,824 | 0 | $749,000 | $790,000 | $433 | 1.05 | 35 | 63 |
| 1251 Via Lucero | Oceanside | 2017 | 04/29/2026 | 3 | 4 | 1,569 | 0 | $748,000 | $740,000 | $472 | 0.99 | 44 | 59 |
| Total: 5 · Average | 3.4 | 3.8 | 1,784.4 | 294,511 | $762,800 | $762,800 | $434.2 | — | 45.4 | ||||
| Median | 1,767 | $749,000 | $749,000 | ||||||||||
Market Analysis
List vs Sale $/SqFt
Sale Price Trend
Days on Market
Sale vs List Price
This analysis was generated automatically from MLS data. For an in-depth, human-reviewed valuation, contact Joseph Sardella at josephsardella@gmail.com.