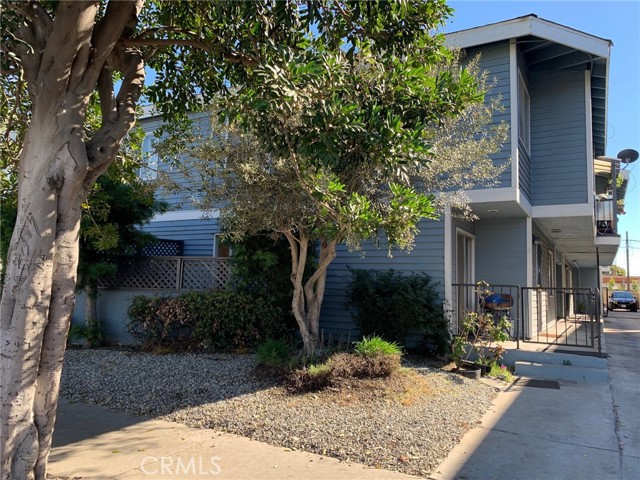
1432 227th, 11, Torrance, CA 90501
1432 227th, 11, Torrance, CA 90501
Property Description
Spacious and bright, this well-kept upper unit shows clear pride of ownership. The living and dining areas open with wood laminate floors and high vaulted ceilings, leading into a tastefully updated kitchen with granite counters, recessed lighting, and tile flooring. The oversized primary bedroom offers triple closet space and a ceiling fan, and the second bedroom is generously sized with triple closet doors as well. Other features include forced-air heat, in-unit laundry, and assigned tandem parking. Bring your buyers!
Features & Amenities
Property Details
Mortgage Calculator
Current Rates
Comparative Market Analysis
Affordable Tier · 5 active · 5 closed
Torrance · Condominium
Listed 6.1% below the median closed sale of $425,000. Price per sqft ($461) is a 18% discount to closed comps ($559).
Price Position
Priced below the market — value advantage over the field.
Active Properties (5)
Active Comparables
| Address | City | Year | BD | BTH | SqFt | LotSz | LP/SqFt | LP | DIM | Score |
|---|---|---|---|---|---|---|---|---|---|---|
| 23320 Sesame Street | Torrance | 1973 | 2 | 2 | 829 | 296,241 | $531 | $440,000 | 22 | 81 |
| 22216 Vermont Avenue | Torrance | 1985 | 2 | 2 | 961 | 181,676 | $463 | $445,000 | 129 | 79 |
| 838 Coriander | Torrance | 1973 | 1 | 1 | 639 | 296,241 | $579 | $369,999 | 107 | 74 |
| 2742 Cabrillo | Torrance | 2006 | 1 | 1 | 670 | 33,059 | $655 | $439,000 | 83 | 73 |
| 20415 Vermont Avenue | Torrance | 1980 | 1 | 1 | 654 | 229,598 | $625 | $409,000 | 16 | 70 |
| Total: 5 · Average | 1.4 | 1.4 | 750.6 | 207,363 | $570.6 | $420,599.8 | 71.4 | |||
| Median | 670 | $439,000 | ||||||||
Closed Properties (5)
Closed Comparables
| Address | City | Year | Date | BD | BTH | SqFt | LotSz | LP | SP | SP/SqFt | SP/LP | DIM | Score |
|---|---|---|---|---|---|---|---|---|---|---|---|---|---|
| 23300 Marigold Avenue | Torrance | 1973 | 01/05/2026 | 2 | 1 | 796 | 209,813 | $449,000 | $449,000 | $564 | 1.00 | 185 | 79 |
| 1125 Sepulveda Boulevard | Torrance | 1973 | 10/29/2026 | 1 | 1 | 618 | 238,253 | $399,000 | $385,000 | $623 | 0.96 | 58 | 77 |
| 806 Coriander | Torrance | 1973 | 08/04/2026 | 2 | 2 | 829 | 296,241 | $444,999 | $425,000 | $513 | 0.95 | 133 | 76 |
| 23334 Sesame | Torrance | 1973 | 06/29/2026 | 2 | 2 | 829 | 296,241 | $429,999 | $430,000 | $519 | 1.00 | 67 | 76 |
| 838 Coriander Drive | Torrance | 1973 | 08/19/2026 | 1 | 1 | 639 | 296,241 | $374,000 | $369,000 | $577 | 0.99 | 96 | 74 |
| Total: 5 · Average | 1.6 | 1.4 | 742.2 | 267,357.8 | $411,600 | $411,600 | $559.2 | — | 107.8 | ||||
| Median | 796 | $425,000 | $425,000 | ||||||||||
Market Analysis
List vs Sale $/SqFt
Sale Price Trend
Days on Market
Sale vs List Price
This analysis was generated automatically from MLS data. For an in-depth, human-reviewed valuation, contact Joseph Sardella at josephsardella@gmail.com.