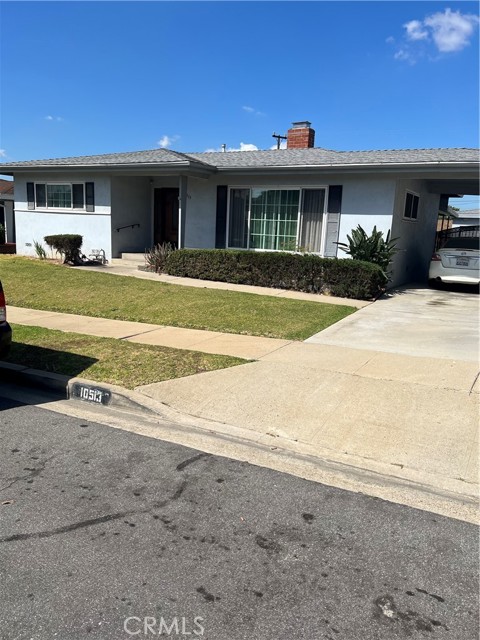
10513 South 5th, Inglewood, CA 90303
10513 South 5th, Inglewood, CA 90303
Property Description
This charming 3 bedroom, 1-1/2 bath home is located in a highly desirable neighborhood and offers comfort, space, and convenience. Features include central air and heat, soundproof windows and doors, a covered patio, and a large backyard perfect for relaxing or entertaining. The home welcomes you with a spacious entryway that leads into a bright and inviting living room with a cozy fireplace, creating the perfect setting for family gatherings or quiet evenings at home.
Features & Amenities
Property Details
Mortgage Calculator
Current Rates
Comparative Market Analysis
Residential Tier · 5 active · 5 closed
Inglewood · Single Family Residence
Listed 6.2% below the median closed sale of $800,000. Price per sqft ($483) is a 12% discount to closed comps ($549). Closed comps sold at 102% of list — strong seller's market.
Price Position
Priced below the market — value advantage over the field.
Active Properties (5)
Active Comparables
| Address | City | Year | BD | BTH | SqFt | LotSz | LP/SqFt | LP | DIM | Score |
|---|---|---|---|---|---|---|---|---|---|---|
| 11049 Atkinson Avenue | Inglewood | 1953 | 3 | 2 | 1,415 | 6,440 | $599 | $848,000 | 11 | 93 |
| 1917 Lohengrin | Los Angeles | 1947 | 3 | 2 | 1,521 | 5,657 | $546 | $830,000 | 8 | 90 |
| 9818 2nd | Inglewood | 1962 | 3 | 2 | 2,040 | 6,754 | $402 | $820,000 | 10 | 88 |
| 11804 Wilkie | Hawthorne | 1954 | 3 | 2 | 1,401 | 5,102 | $607 | $849,900 | 93 | 86 |
| 3612 113th | Inglewood | 1942 | 3 | 2 | 1,370 | 6,029 | $577 | $790,000 | 87 | 84 |
| Total: 5 · Average | 3.0 | 2.0 | 1,549.4 | 5,996.4 | $546.2 | $827,580 | 41.8 | |||
| Median | 1,415 | $830,000 | ||||||||
Closed Properties (5)
Closed Comparables
| Address | City | Year | Date | BD | BTH | SqFt | LotSz | LP | SP | SP/SqFt | SP/LP | DIM | Score |
|---|---|---|---|---|---|---|---|---|---|---|---|---|---|
| 10725 8th Avenue | Inglewood | 1954 | 09/22/2026 | 3 | 2 | 1,646 | 6,845 | $840,000 | $820,000 | $498 | 0.98 | 49 | 96 |
| 11028 Spinning | Inglewood | 1947 | 09/03/2026 | 3 | 1 | 1,630 | 6,284 | $789,000 | $755,000 | $463 | 0.96 | 89 | 89 |
| 10947 Atkinson | Inglewood | 1953 | 07/22/2026 | 3 | 2 | 1,290 | 5,403 | $799,000 | $800,000 | $620 | 1.00 | 40 | 89 |
| 2530 Van Wick Street | Inglewood | 1953 | 04/15/2026 | 3 | 2 | 1,235 | 6,453 | $840,000 | $840,000 | $680 | 1.00 | 67 | 88 |
| 10401 Van Ness Avenue | Inglewood | 1955 | 07/31/2026 | 3 | 2 | 1,532 | 5,882 | $625,000 | $740,750 | $484 | 1.19 | 349 | 88 |
| Total: 5 · Average | 3.0 | 1.8 | 1,466.6 | 6,173.4 | $791,150 | $791,150 | $549 | — | 118.8 | ||||
| Median | 1,532 | $800,000 | $800,000 | ||||||||||
Market Analysis
List vs Sale $/SqFt
Sale Price Trend
Days on Market
Sale vs List Price
This analysis was generated automatically from MLS data. For an in-depth, human-reviewed valuation, contact Joseph Sardella at josephsardella@gmail.com.