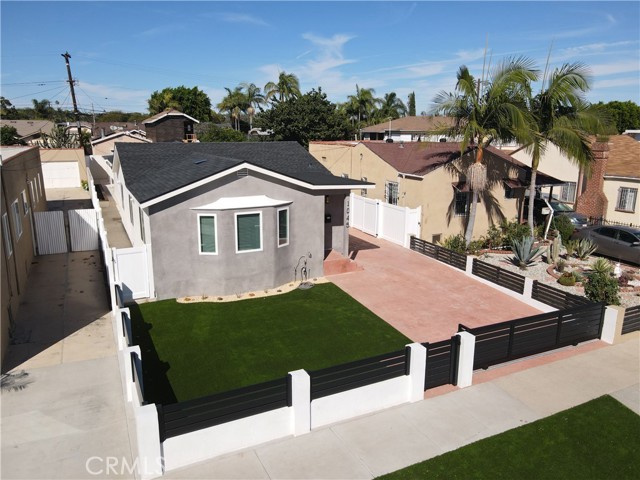
1045 East Hyde Park Boulevard, Inglewood, CA 90302
1045 East Hyde Park Boulevard, Inglewood, CA 90302
Property Description
Fully renovated with additions home with city permits! A MUST SEE! This home features a beautiful floor plan. Private master bedroom with its master bath which includes a sliding door with backyard access. Features include new flooring, recess lighting throughout, new tankless water heater, new plumbing, new electrical wiring, new heating system and AC. Beautifully designed bathrooms featuring smart toilets and mirrors. Also, the bedrooms have ceiling fans and walk-in closets. Home has new roofing! Double pane windows with blinds throughout. Very spacious floorplan. Three bedrooms and two full baths. Exterior has a detached two car garage with plenty of parking in driveway.
Features & Amenities
Property Details
Mortgage Calculator
Current Rates
Comparative Market Analysis
Affordable Tier · 5 active · 5 closed
Inglewood · Single Family Residence
Listed 8.3% above the median closed sale of $1,015,000. Price per sqft ($753) is a 20% premium to closed comps ($626).
Price Position
Positioned above the market — commands a premium.
Active Properties (5)
Active Comparables
| Address | City | Year | BD | BTH | SqFt | LotSz | LP/SqFt | LP | DIM | Score |
|---|---|---|---|---|---|---|---|---|---|---|
| 6318 Eileen Avenue | Los Angeles | 1924 | 3 | 2 | 1,449 | 5,650 | $655 | $949,000 | 37 | 90 |
| 3630 61st | Los Angeles | 1932 | 3 | 2 | 1,736 | 6,105 | $605 | $1.05M | 146 | 87 |
| 6015 Keniston | Los Angeles | 1924 | 3 | 2 | 1,350 | 5,932 | $722 | $974,900 | 10 | 87 |
| 1316 Chester Avenue | Inglewood | 1922 | 3 | 2 | 1,284 | 5,618 | $739 | $949,000 | 45 | 85 |
| 6307 Long Street | Los Angeles | 1928 | 4 | 3 | 1,786 | 5,442 | $587 | $1.05M | 19 | 80 |
| Total: 5 · Average | 3.2 | 2.2 | 1,521 | 5,749.4 | $661.6 | $994,380 | 51.4 | |||
| Median | 1,449 | $974,900 | ||||||||
Closed Properties (5)
Closed Comparables
| Address | City | Year | Date | BD | BTH | SqFt | LotSz | LP | SP | SP/SqFt | SP/LP | DIM | Score |
|---|---|---|---|---|---|---|---|---|---|---|---|---|---|
| 6325 Long Street | Los Angeles | 1924 | 08/27/2026 | 3 | 2 | 1,486 | 5,442 | $999,000 | $1.01M | $680 | 1.01 | 148 | 89 |
| 6227 Long Street | Los Angeles | 1925 | 06/24/2026 | 3 | 2 | 1,320 | 5,440 | $949,000 | $1.00M | $761 | 1.06 | 41 | 86 |
| 6312 Verdun Avenue | Los Angeles | 1950 | 07/21/2026 | 3 | 2 | 1,260 | 6,303 | $1.03M | $1.01M | $806 | 0.98 | 209 | 83 |
| 3815 60th Street | Los Angeles | 1923 | 08/27/2026 | 6 | 4 | 2,622 | 5,242 | $1.19M | $1.13M | $429 | 0.95 | 121 | 55 |
| 3726 59th Street | Los Angeles | 1924 | 07/02/2026 | 6 | 5 | 2,536 | 6,752 | $1.20M | $1.15M | $453 | 0.96 | 35 | 51 |
| Total: 5 · Average | 4.2 | 3.0 | 1,844.8 | 5,835.8 | $1.06M | $1.06M | $625.8 | — | 110.8 | ||||
| Median | 1,486 | $1.01M | $1.01M | ||||||||||
Market Analysis
List vs Sale $/SqFt
Sale Price Trend
Days on Market
Sale vs List Price
This analysis was generated automatically from MLS data. For an in-depth, human-reviewed valuation, contact Joseph Sardella at josephsardella@gmail.com.