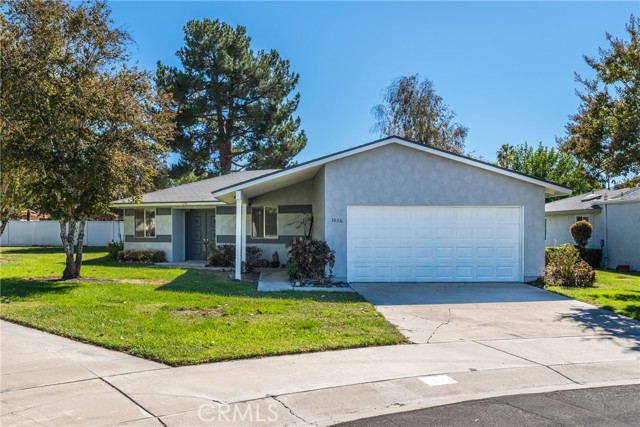
1036 Occidental Circle, Redlands, CA 92374
1036 Occidental Circle, Redlands, CA 92374
Property Description
Welcome to Solar Villas. Unique design with a private atrium that brings the outdoors in, energy efficient concrete construction and newly paved streets. Three good sized bedrooms and two baths, efficient open concept kitchen, separate dining area with a recently remodeled main bathroom. Freshly painted inside and out in September and a clear termite report. The homeowners association dues cover the yard maintenance, water, sewer and trash collection making this home even more affordable. Conveniently located near shopping, schools and easy freeway access this is the one are you've been waiting for. Now is the time and this is the place!
Features & Amenities
Property Details
Mortgage Calculator
Current Rates
Comparative Market Analysis
Affordable Tier · 5 active · 5 closed
Redlands · Single Family Residence
Listed 6.8% below the median closed sale of $499,000. Price per sqft ($308) is a 20% discount to closed comps ($383). Closed comps sold at 100% of list — strong seller's market.
Price Position
Priced below the market — value advantage over the field.
Active Properties (5)
Active Comparables
| Address | City | Year | BD | BTH | SqFt | LotSz | LP/SqFt | LP | DIM | Score |
|---|---|---|---|---|---|---|---|---|---|---|
| 1076 Occidental Circle | Redlands | 1984 | 3 | 2 | 1,512 | 1,512 | $308 | $465,000 | 83 | 95 |
| 140 W Pioneer Ave | Redlands | 1988 | 3 | 2 | 1,574 | 4,368 | $286 | $450,000 | 74 | 85 |
| 140 Pioneer | Redlands | 1989 | 3 | 2 | 1,558 | 4,368 | $292 | $455,000 | 23 | 84 |
| 140 Pioneer | Redlands | 1989 | 2 | 2 | 1,101 | 4,368 | $380 | $418,000 | 81 | 77 |
| 701 11TH STREET | Redlands | 1928 | 3 | 1 | 1,200 | 6,490 | $432 | $519,000 | 59 | 69 |
| Total: 5 · Average | 2.8 | 1.8 | 1,389 | 4,221.2 | $339.6 | $461,400 | 64 | |||
| Median | 1,512 | $455,000 | ||||||||
Closed Properties (5)
Closed Comparables
| Address | City | Year | Date | BD | BTH | SqFt | LotSz | LP | SP | SP/SqFt | SP/LP | DIM | Score |
|---|---|---|---|---|---|---|---|---|---|---|---|---|---|
| 813 Doyle Avenue | Redlands | 1978 | 08/10/2026 | 3 | 2 | 1,196 | 9,135 | $495,000 | $500,000 | $418 | 1.01 | 61 | 83 |
| 1502 Berkeley Drive | Redlands | 1979 | 08/20/2026 | 3 | 2 | 1,151 | 7,480 | $499,950 | $507,500 | $441 | 1.01 | 51 | 82 |
| 1104 Pennsylvania Avenue | Redlands | 1979 | 09/17/2026 | 4 | 2 | 1,423 | 8,700 | $499,000 | $499,000 | $351 | 1.00 | 38 | 80 |
| 1631 Church | Redlands | 1971 | 06/01/2026 | 3 | 2 | 1,130 | 7,956 | $455,000 | $430,000 | $381 | 0.94 | 34 | 78 |
| 1626 Jason Court | Redlands | 1971 | 07/01/2026 | 4 | 2 | 1,308 | 7,242 | $410,000 | $425,000 | $325 | 1.04 | 21 | 78 |
| Total: 5 · Average | 3.4 | 2.0 | 1,241.6 | 8,102.6 | $472,300 | $472,300 | $383.2 | — | 41 | ||||
| Median | 1,196 | $499,000 | $499,000 | ||||||||||
Market Analysis
List vs Sale $/SqFt
Sale Price Trend
Days on Market
Sale vs List Price
This analysis was generated automatically from MLS data. For an in-depth, human-reviewed valuation, contact Joseph Sardella at josephsardella@gmail.com.